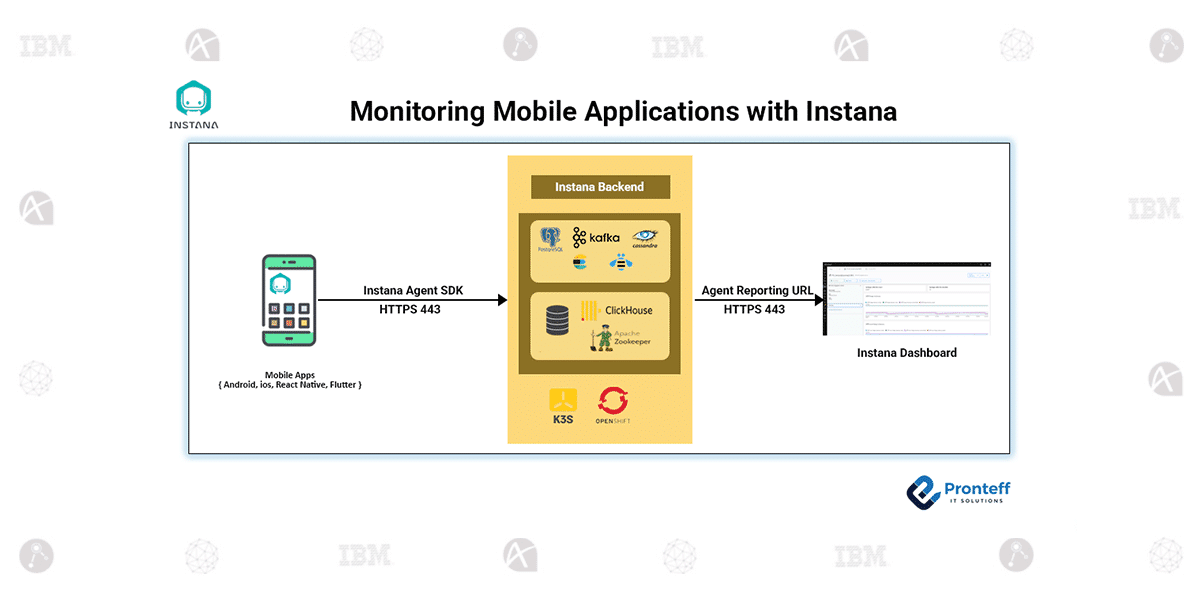
Monitoring Mobile Applications with Instana
In this blog, we will learn how to monitor mobile applications with Instana.
Introduction
In today’s world, mobile apps form a critical part of the digital experience. Whether you’re providing services, content or internal tools, understanding how users interact and how the app performs is crucial. That’s where observability comes in — and the mobile-app monitoring capabilities of Instana provide a strong foundation to track, analyse, and optimise mobile user experiences.
What Instana Offers for Mobile Apps
Instana supports mobile-app monitoring by analysing actual URL request times, and giving you deep visibility into application call-paths.
Key features include:
- An agent installed in the mobile app (for iOS, Android, React Native, Flutter).
- End-user monitoring (EUM) or real user monitoring (RUM) to understand actual user experience.
- Traffic, crash analytics, view navigation, geographic mapping, custom events and more.
Installing the Agent:
iOS
- Requires iOS 12 or later, Swift 5.4+
- Install via Swift Package Manager or CocoaPods.
Android
- Requires Android 4.1+ (API level 16+), Java 8+, AndroidX, targetSdk 33+
- Use Gradle plug-in plus SDK dependency.
React Native & Flutter
- React Native: supports both Android & iOS; install @instana/react-native-agent.
- Flutter: supports both platforms; install via pubspec.yaml. Note: HTTP tracing is manual.
Key Monitoring Capabilities:
Dashboard & KPIs:
You’ll get dashboards showing:
- Session starts (when a user launches the app)
- Unique users (or user session identifiers)
- View transitions (when user moves from one screen/view to another)
- Crash-affected session rate and crash-affected user rate — very useful to understand impact.
Performance & HTTP Requests
- Get metrics like app start time, “app not responding”, low memory events.
- Drill into HTTP requests: throughput, latency, error rates, endpoints causing issues.
Crashes
- Crashes are grouped by error type/message; you can view which version, OS, device caused the crash.
- For deeper analysis on iOS you upload dSYM files, on Android mapping files.
Views & Custom Events
- You can isolate individual views/screens and analyse their performance metrics.
- Custom events: you define them; use them to monitor business-relevant flows (e.g., “Purchase Completed”, “User Logged In”).
Analytics & Geo Data
- Instana collects beacon data (session start, HTTP requests) which you can query, filter and group via Instana Analytics.
- It also maps end-user IP addresses to geographic details (city, country) using MaxMind’s GeoIP database.
Why This Matters
For someone administering or monitoring mobile apps (which in your case, with your backend / middleware focus could be a complementary domain), this kind of visibility gives you:
- Real-time detection of performance degradations: e.g., high latency HTTP calls, large un-handled memory usage.
- Better crash insight: identify which users, devices, OS versions are being impacted.
- Business insight: correlate app usage (sessions, views) with backend performance.
- Cross-platform support: whether native iOS/Android or hybrid React Native/Flutter, you have one solution.
Things to Watch / Best Practices:
- Make sure your agent versions are compatible with your platform (OS, framework).
- For React Native/Flutter: note limitations (e.g., Flutter requires manual HTTP tracing).
- For crashes, ensure you upload symbol/mapping files so you get full stack traces.
- Set identity (user ID) when possible so you see unique users rather than anonymous sessions.
- Avoid inhibiting app performance by monitoring: ensure the instrumentation overhead is minimal.
- Because you’re dealing with middleware/infrastructure, ensure your backend services propagate tracing info (e.g., correlation IDs) so end-to-end trace works.
Conclusion
With Instana’s mobile-app monitoring you unlock a critical piece of the observability puzzle — the user’s device. Combined with your knowledge of backend middleware, you can now connect the dots: from a user tapping an app, to the device, to the API call, to your middleware. That gives you stronger insight, faster failures identification, and better optimisation opportunities.


