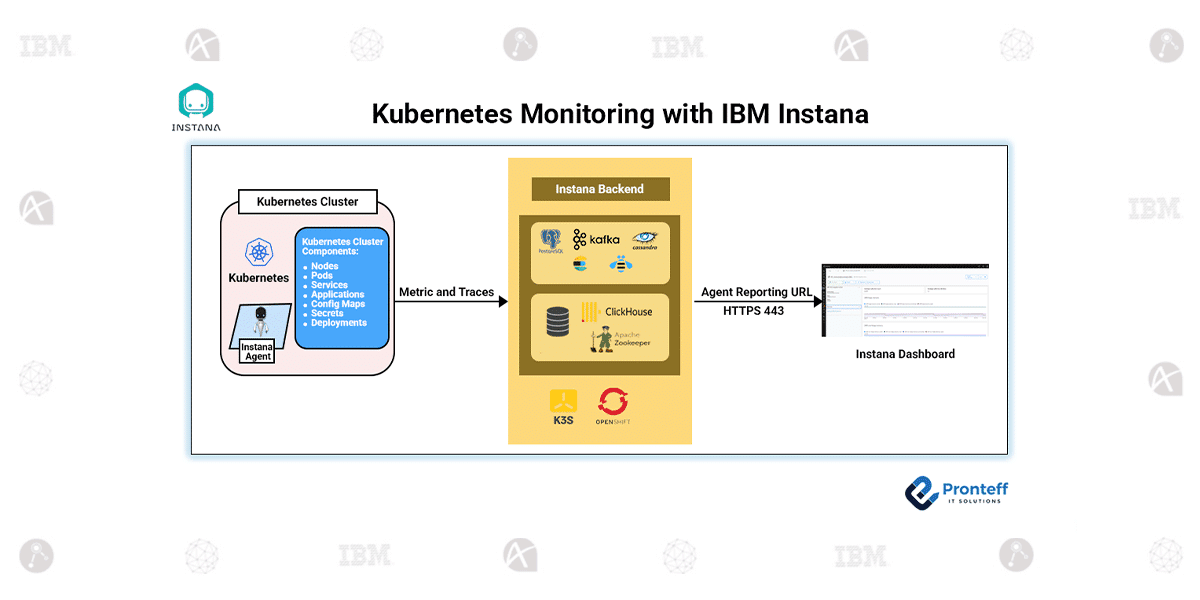
Kubernetes Monitoring with IBM Instana
In this blog, we will learn how to monitor Kubernetes with IBM Instana.
Kubernetes has become the standard platform for running modern applications, but its dynamic nature makes monitoring a challenge. Containers start and stop frequently, workloads scale automatically, and services communicate in complex patterns. To operate such environments reliably, teams need continuous and automated visibility.
IBM Instana Observability provides native Kubernetes monitoring that focuses on automatic discovery, real-time insights, and clear correlation between infrastructure and applications.
Why Observability Is Essential for Kubernetes
Unlike traditional environments, Kubernetes is constantly changing:
- Pods are short-lived
- Services are loosely coupled
- Scaling and rescheduling happen automatically
- Failures may be temporary, but still impact users
Because of this, simply collecting metrics is not enough. Observability must explain what changed, where it happened, and how it affects applications.
How Instana Monitors Kubernetes
Instana uses an automatic discovery model. Once present in a Kubernetes cluster, it continuously detects:
- Cluster structure
- Workloads and services
- Resource usage and health
- Relationships between infrastructure and applications
This happens without manual configuration, ensuring visibility keeps up with cluster changes.
Supported Kubernetes Versions
Instana follows a rolling support strategy aligned with Kubernetes releases:
- Supports the latest Kubernetes version
- Supports the previous four minor versions
- The oldest two in that range are considered soft-deprecated
Example:
If the current Kubernetes version is 1.31, Instana supports:
- 1.27 (soft-deprecated)
- 1.28 (soft-deprecated)
- 1.29
- 1.30
- 1.31
This approach balances stability and modern feature compatibility, giving organizations time to upgrade safely.
Sensors Used for Kubernetes Monitoring
Instana relies on sensors, which are lightweight monitoring components that activate automatically when supported technologies are detected.
Main Sensors in Kubernetes Environments
| Sensor | What It Covers |
| Kubernetes Sensor | Cluster, namespaces, nodes, pods, deployments, services |
| Container Runtime Sensor | CPU, memory, network usage at container level |
| Service Discovery Sensor | Identifies services and maps dependencies |
| Health & Event Sensor | Tracks health states and configuration changes |
These sensors work together to build a complete and continuously updated view of the Kubernetes environment.
Supported Kubernetes Platforms
Instana supports Kubernetes consistently across:
- Self-managed clusters
- Managed services (EKS, AKS, GKE)
- Enterprise platforms such as OpenShift and Tanzu
The monitoring behavior and visibility remain the same, regardless of where the cluster runs.
What Instana Delivers to Operations Teams
Within the Instana UI, teams gain:
- Cluster and namespace health overviews
- Resource consumption trends
- Service dependency maps
- Clear links between infrastructure issues and application impact
- Faster identification of root causes
This allows teams to move from reactive troubleshooting to proactive operations.
Summary
Kubernetes environments demand monitoring solutions that can adapt to constant change. IBM Instana Observability provides this by combining automatic discovery, intelligent sensors, and real-time analytics.
By delivering a unified view of clusters, services, and applications, Instana enables teams to operate Kubernetes platforms with confidence, clarity, and speed.


