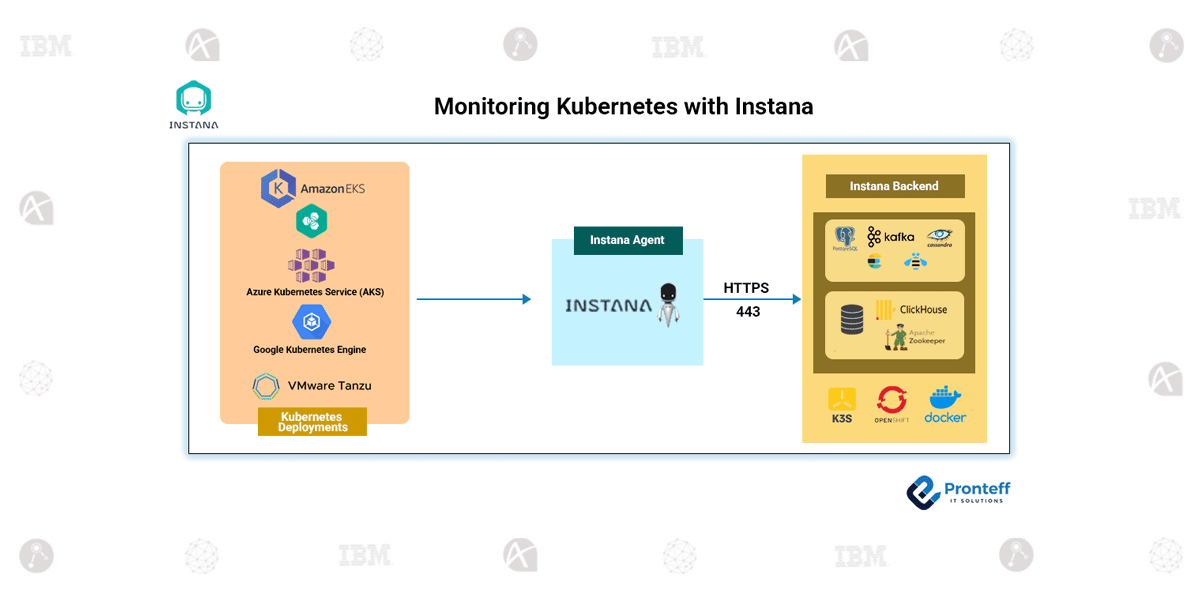
Monitoring Kubernetes with Instana
In this blog, we will learn about monitoring Kubernetes with Instana.
Kubernetes is now the core platform for running cloud-native applications, valued for its ability to manage containers at scale with flexibility and automation. But this power also brings complexity—clusters are dynamic, workloads constantly move, and pinpointing issues across services can be difficult.
Instana addresses this challenge by giving organizations a complete picture of their Kubernetes environments, combining real-time monitoring with intelligent analytics. It doesn’t just show raw data; it provides the context needed to understand how infrastructure and applications interact.
Why Instana Fits Kubernetes Monitoring
Unlike traditional monitoring tools, Instana is built with cloud-native environments in mind. Its strengths include:
- Visibility of Cluster Health – Tracks nodes, pods, and workloads in real time.
- Application Context – Links metrics, traces, and logs back to the Kubernetes objects they belong to.
- Service Relationships – Maps how services communicate with each other, making it easier to detect bottlenecks.
- Early Warnings – Provides ready-to-use health rules while allowing customization to match business needs.
- Smooth Troubleshooting – Shows the chain of events behind an issue, reducing time to resolution.
These features make operations more predictable and help teams maintain stability, even as clusters grow in size and complexity.
Broad Platform Support
Instana works across major managed Kubernetes services, including Amazon EKS, Azure AKS, Google GKE, IBM Cloud Kubernetes Service, and VMware Tanzu. This flexibility ensures organizations can use one monitoring platform across hybrid or multi-cloud strategies.
It also integrates with service meshes such as Istio, meaning even highly distributed microservice environments remain observable.
What Instana Monitors
Instana automatically builds a real-time model of the Kubernetes landscape:
- Infrastructure – Clusters, nodes, namespaces
- Workloads – Deployments, pods, StatefulSets, DaemonSets, and jobs
- Storage – Persistent Volumes and Claims
- Scaling Activity – Replica counts and autoscaler activity
By tying these layers together, Instana highlights how changes in one area affect the rest of the system.
Dashboards, Health Monitoring & Alerts
- Intuitive Dashboards
- Cluster overviews show health across namespaces.
- Resource usage compared against defined limits.
- Context maps display service and infrastructure dependencies.
- Analytics link logs, traces, and metrics for faster investigations.
- Health Monitoring & Alerts
- Built-in rules detect common issues (CPU/memory spikes, unavailable replicas, pod delays).
- Custom thresholds can be defined for critical workloads.
- Ensures proactive detection, faster troubleshooting, and workload reliability.
Conclusion
Kubernetes is powerful but complex, and effective monitoring is essential to keep it running smoothly. Instana brings together infrastructure metrics, application traces, and service dependencies into a single, intelligent platform.
With Instana, organizations don’t just see what’s happening—they understand why it’s happening and what to do next. This makes Kubernetes monitoring more proactive, more reliable, and more aligned with business goals.


