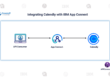
Record & Replay: IBM app connect 11.0.0.4
Data that is being processed by a message flow can be recorded, viewed, and replayed. This functionality is important for auditing or determining the source of an issue.
You can then view the data, or replay it by resending the message to an MQ queue through the web user interface.
The following steps to configure record and replay…
A). Database Connection configuration:
1. We have to Run script DataCaptureSchema.sql from sql server. This script is available under “C:\Program Files\IBM\ACE\11.0.0.4\server\ddl\Sql Server\ DataCaptureSchema.sql”, it create the database and database tables.
2. After creating the database, you create an ODBC definition to identify the data source name (DSN) for the database.
3. We have to create integration node; it must associate a queue manager with the integration node using command or change option in toolkit
mqsicreatebroker -q
4. We need use the mqsisetdbparms command to set a user identifier and password for the integration node to use when connecting to the database.
mqsisetdbparms -n -u -p
5. Use the mqsicvp command to verify ODBC connections.
mqsicvp -n
B). configure the record and Replay store for your integration server:-
1. We have to modify the server.conf.yaml file to configure recording for your integration server.
2. Server.conf.yaml files available under this path “C:\ProgramData\IBM\MQSI\components\\servers\\ server.conf.yaml”
3. Open the Server.conf.yaml for your integration server
4. The properties that we need to set in the RecordReplay section of the server.conf.yaml configuration file:
recordReplayEnabled: true
All Set to true to enable all Record and Replay functionality. Default is true.
Stores: -> DataStore:
dataSource: ‘TESTDBA’ # The ODBC data source name (DSN) that is used to connect to db that stores the recorded data
schema: ‘dbo’
storeMode: ‘all’
queue: ‘SYSTEM.BROKER.DC.RECORD’
backoutQueue: ‘SYSTEM.BROKER.DC.BACKOUT’
useCoordinatedTransaction: false
commitCount: 10
threadPoolSize: 10
commitIntervalSecs: 5
6. We have to create ‘SYSTEM.BROKER.DC.RECORD’ and ‘SYSTEM.BROKER.DC.BACKOUT’ queue for integration node associated queue manager
7. Rename the section title ‘SourceTemplate’ and enable the all required properties (By removing #) and set the property values in server.conf.yaml file
Sources: -> DataSource:
topic:’$SYS/Broker//Monitoring// /Flow_Name(or)#’
store: ‘DataStore’
8. Rename the section title ‘MQDestinationTemplate’ and enable the all required properties (By removing #) and set the property values in server.conf.yaml file
Destinations: -> DataMQDestination:
endpointType: ‘WMQDestination’
endpoint: ‘wmq:/msg/queue/@’
9. After assigning all the property value restart the integration node
C) .Configure monitoring on your message flows:
1. Configure monitoring on a message flow to emit events for record and replay.
2. You can create a monitoring profile and deploy it to the integration server where your message flows are deployed.
3. By default Monitoring property is inactive in server.conf.yaml and node.conf.yaml file activate monitoring for the message flow by setting ‘active’ value
Monitoring: -> MessageFlow:
publicationOn: ‘active’
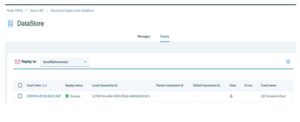
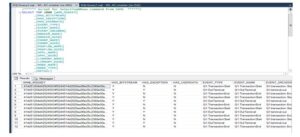
Recorded Data:
View Data:
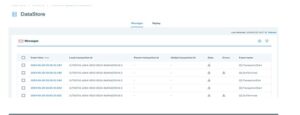
Replay Data: