Creating a custom Dashboard for visualizing 3xx error status codes
In this blog, we will learn how to create a custom dashboard for visualizing 3xx error status codes.
- Log On to API Manager, click on ‘Manage’ present in the left Panel, and select the Catalog you want to modify the Analytics.
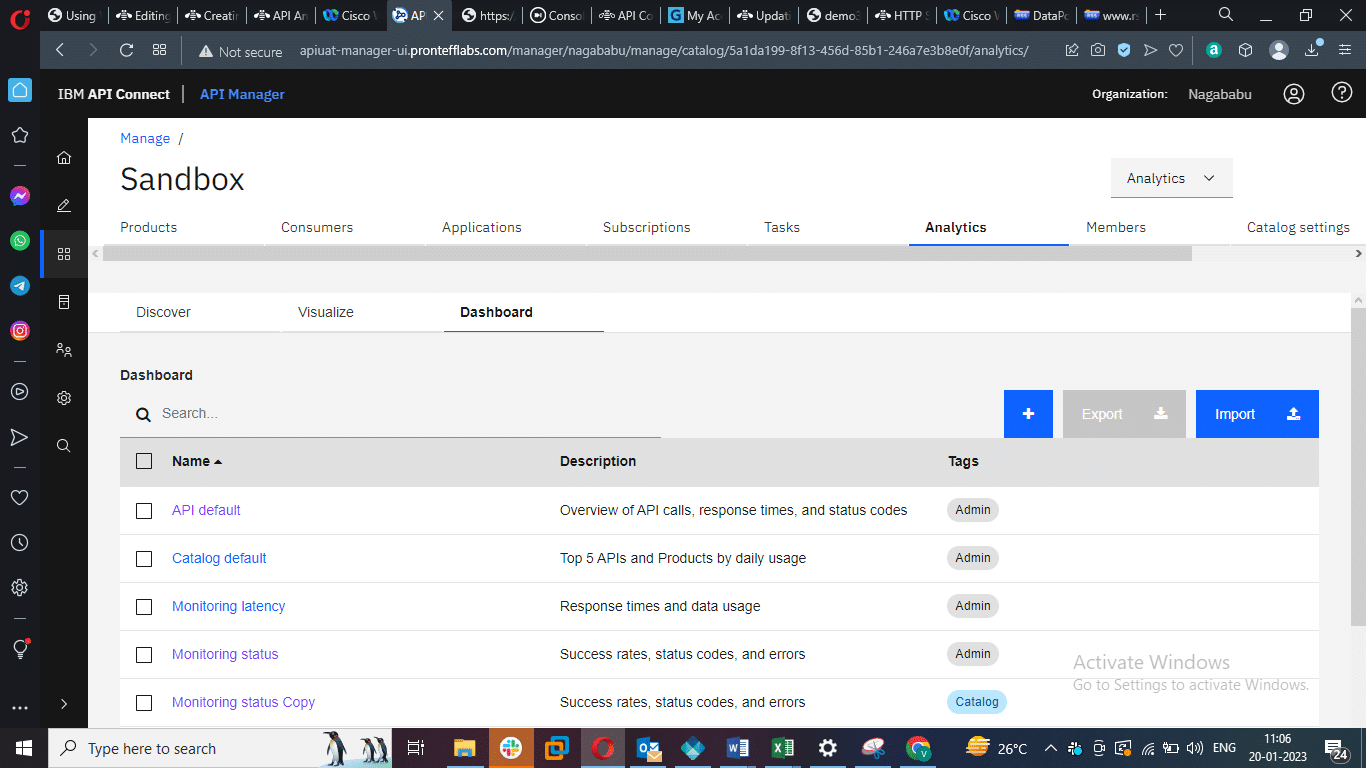
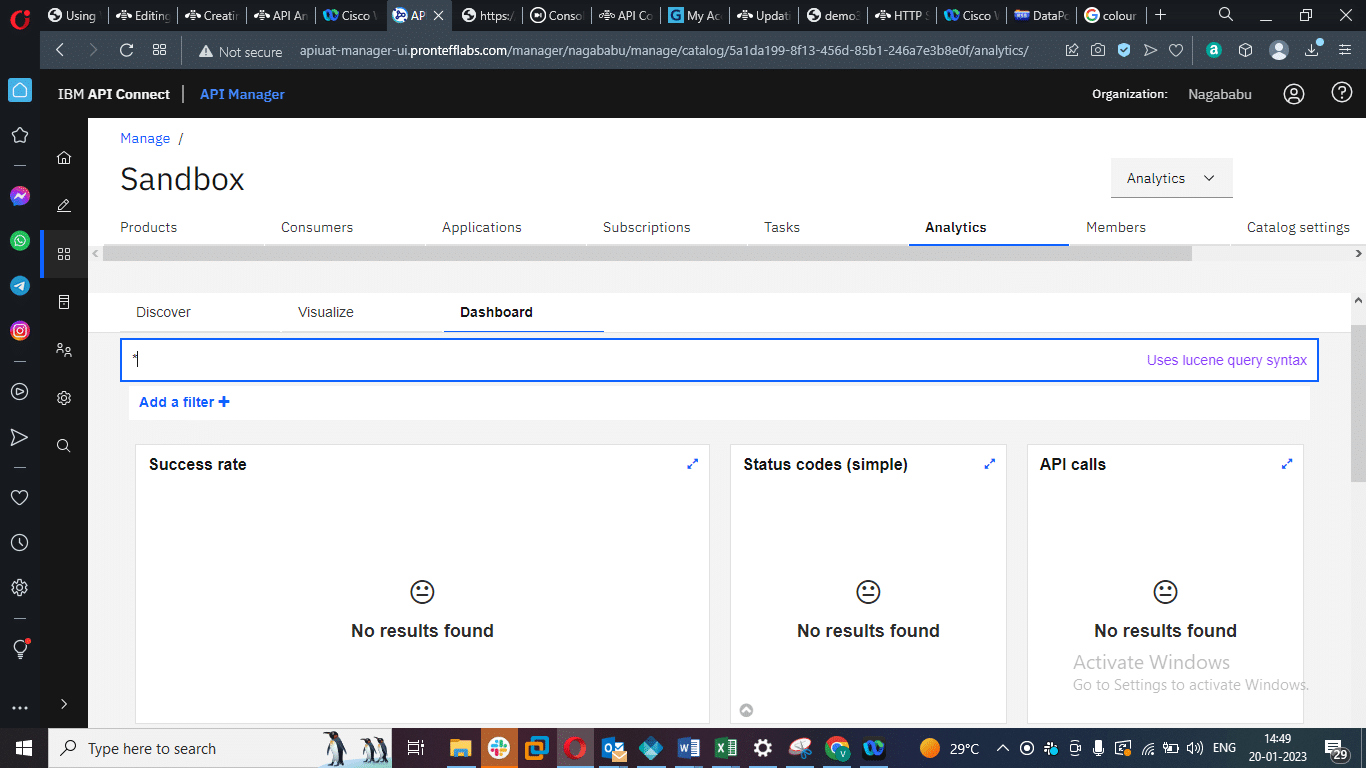
- Click on Dashboard, and you will see the Default Dashboard.

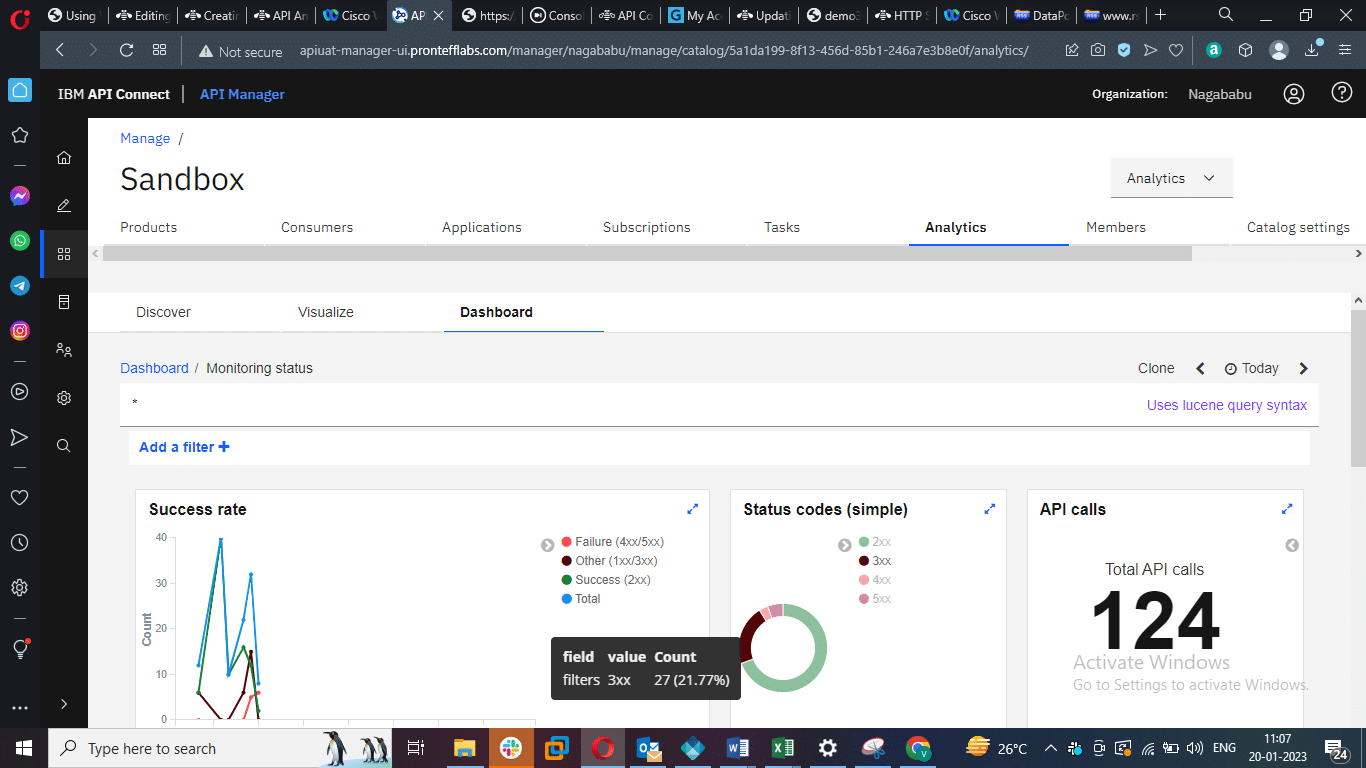
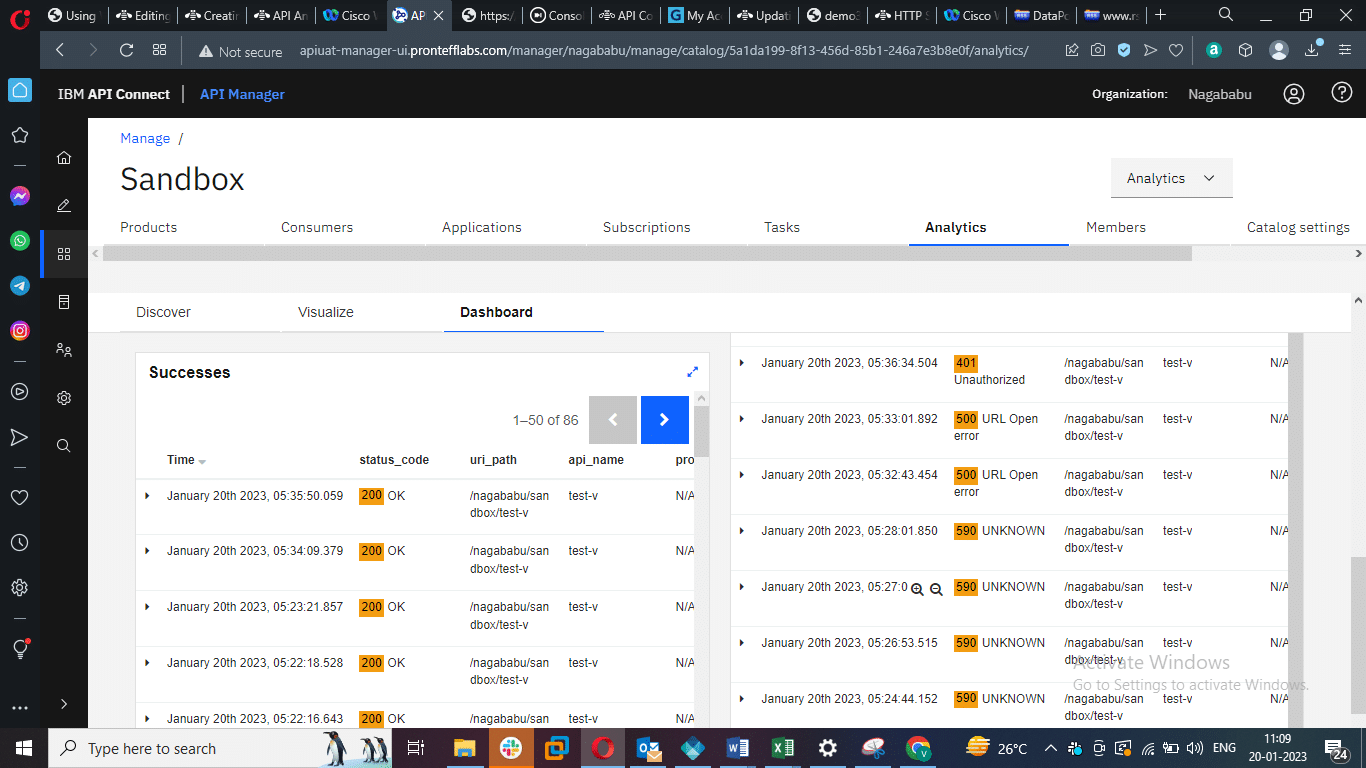
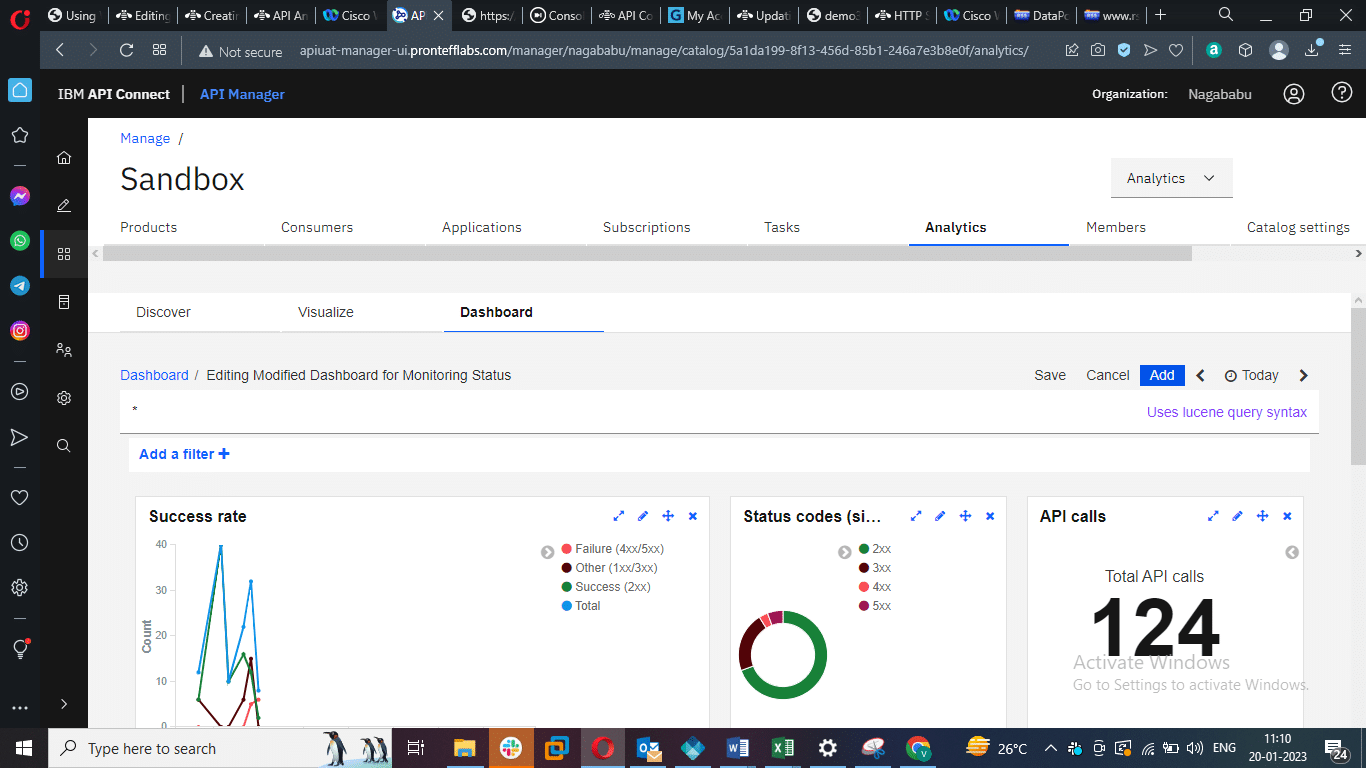
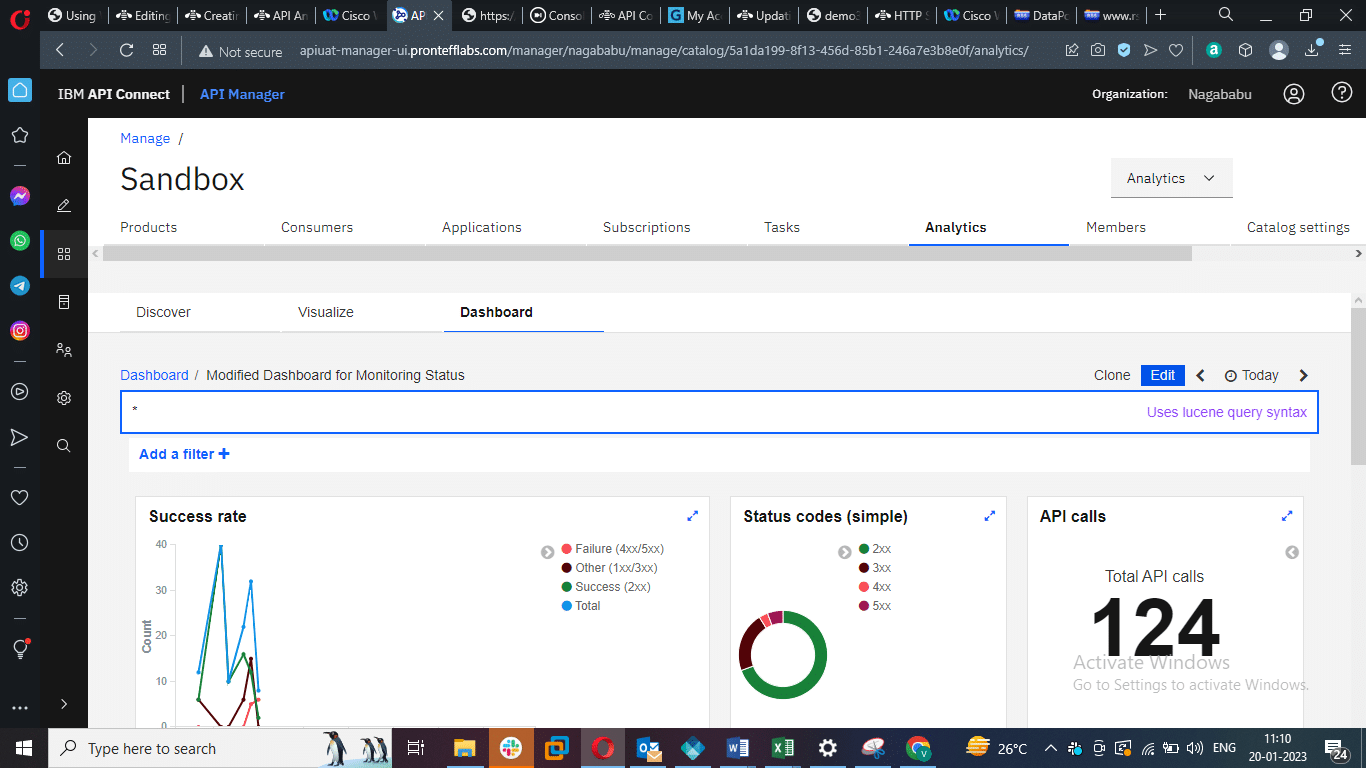
- Click on ‘Monitoring Status’ in the Default Dashboard, and you’ll see the content below.

- You can see the colour differences for each and every error code series.
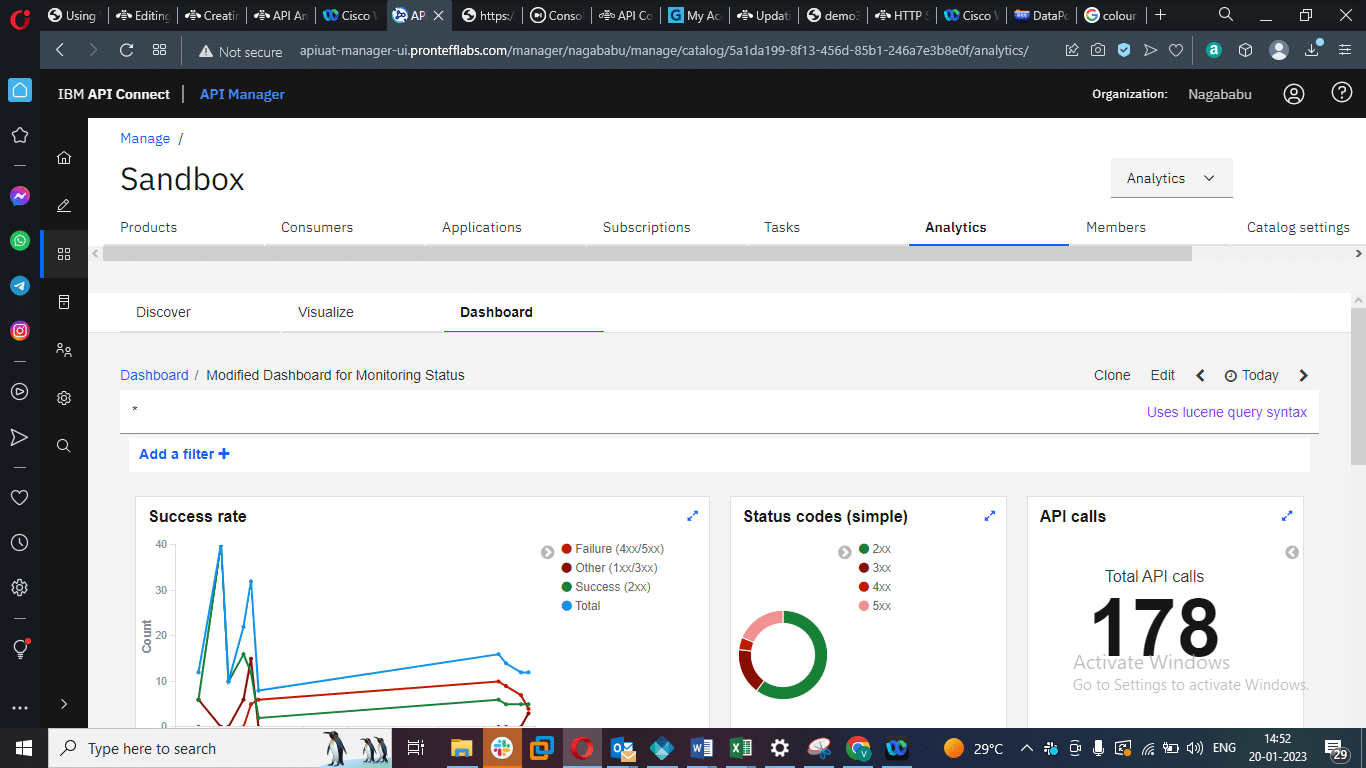
- Go to status codes and click on the 3xx Color.
- Then you can see as below.
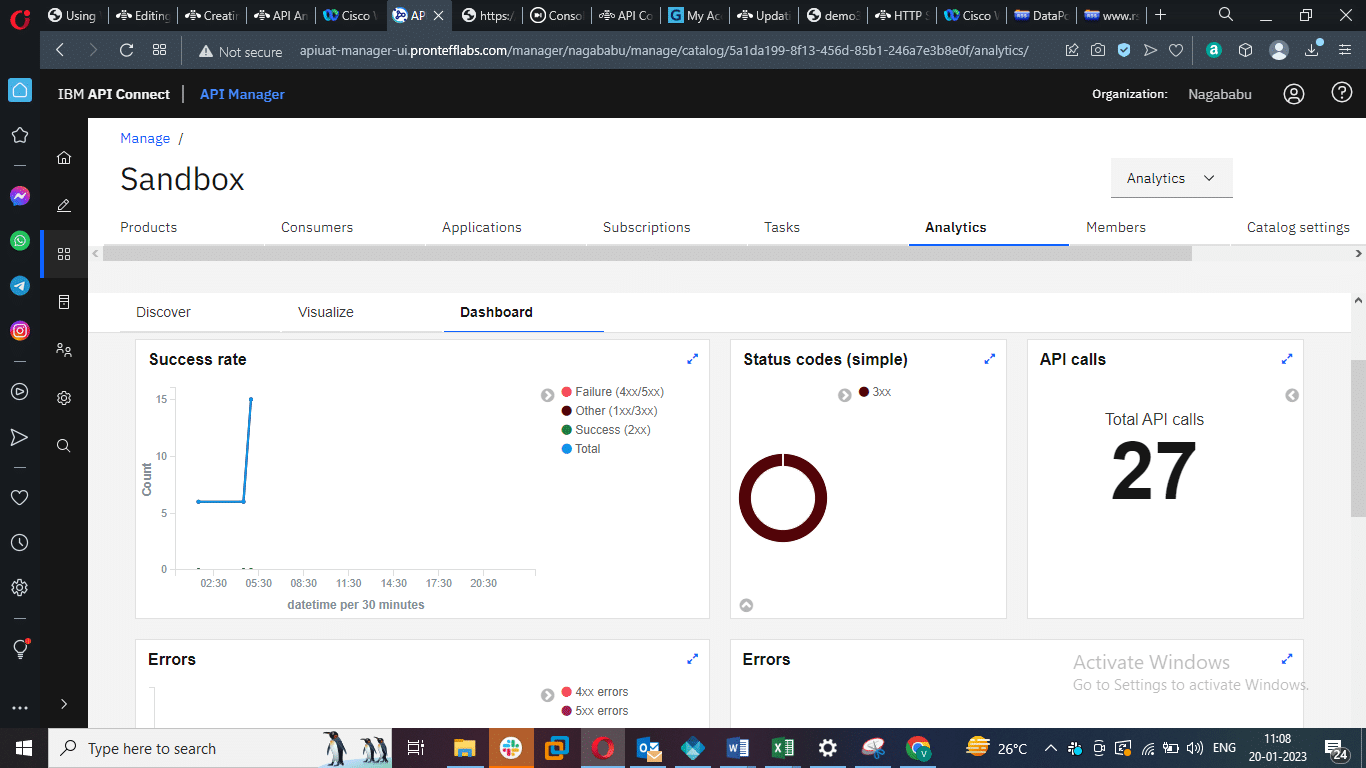
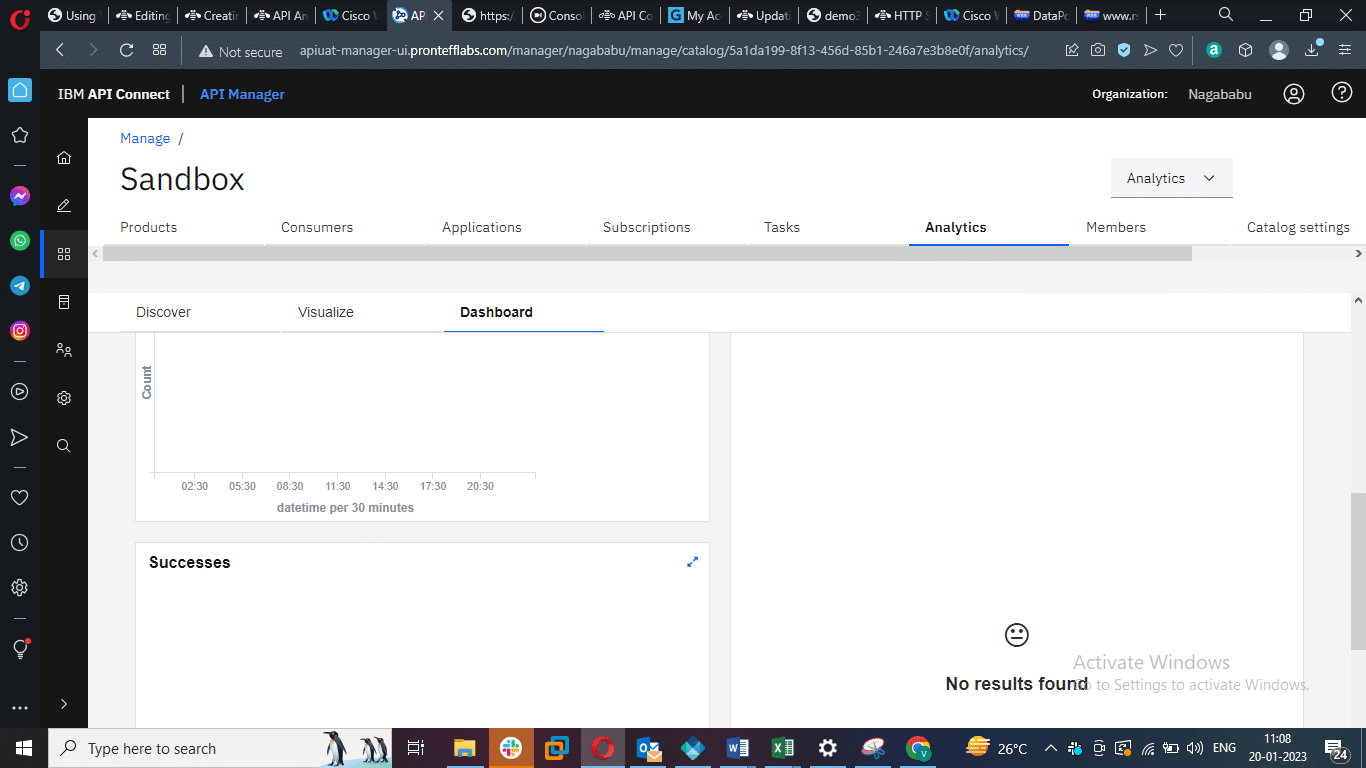
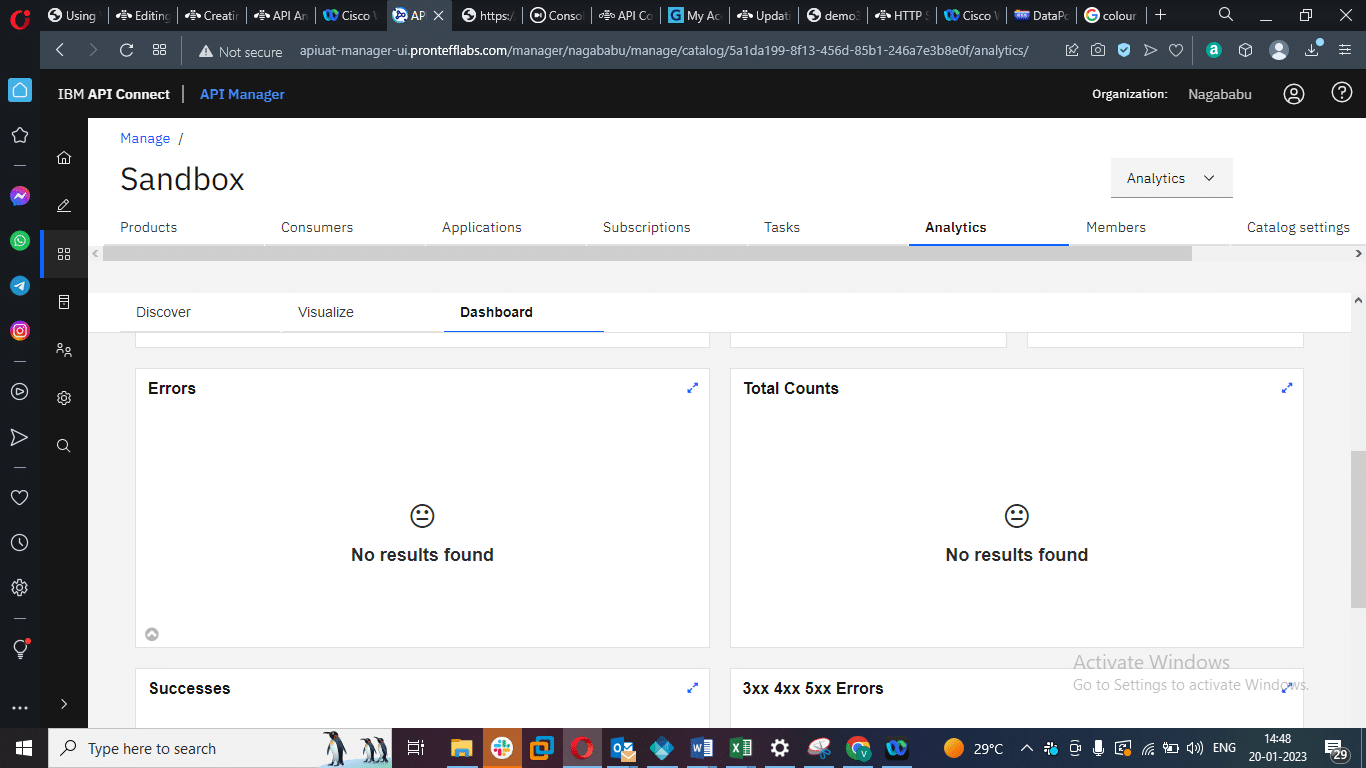
- Scroll down and see the Errors. There are no errors regarding the 3xx series caught here, but you can find 4xx and 5xx Errors if they occur.
- To create a Customized Dashboard, follow the steps below :
Step 1: Go to Discover, click on Errors, and
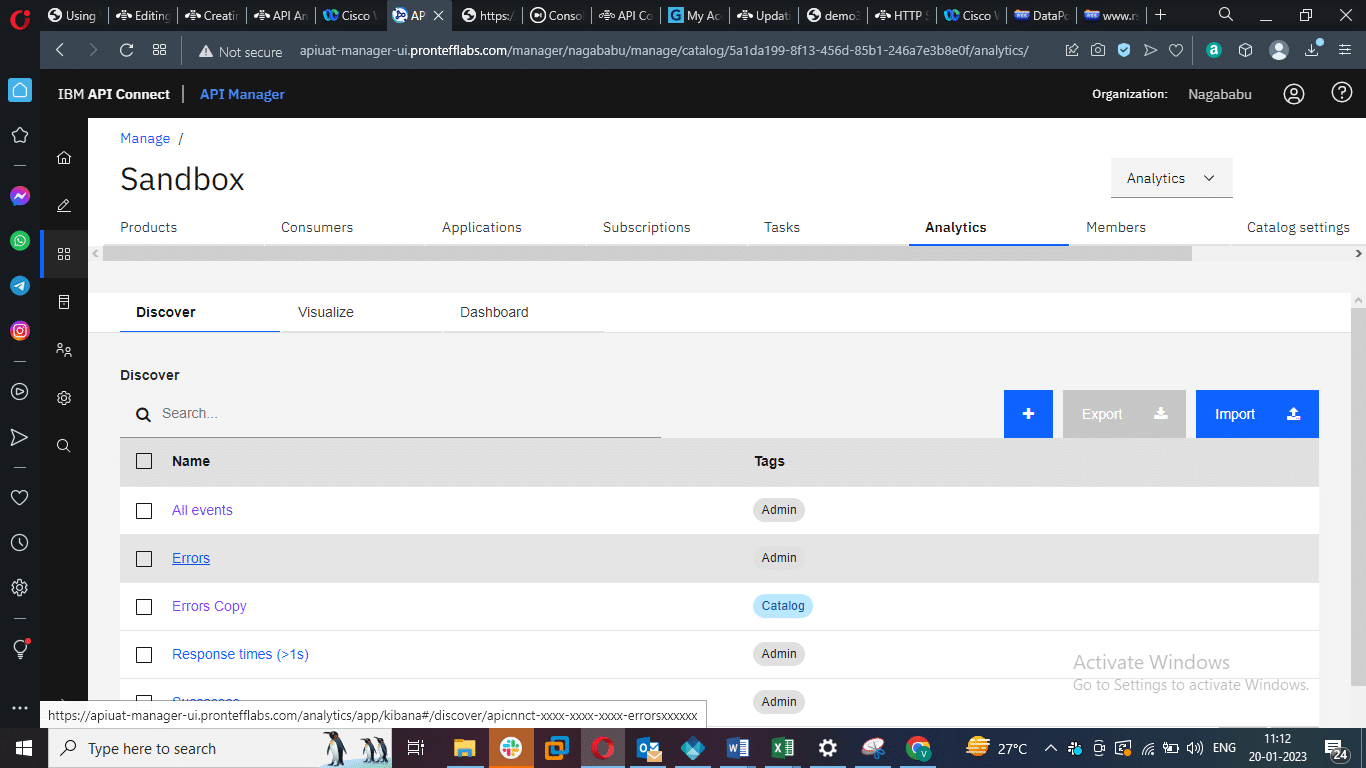
Clone it.
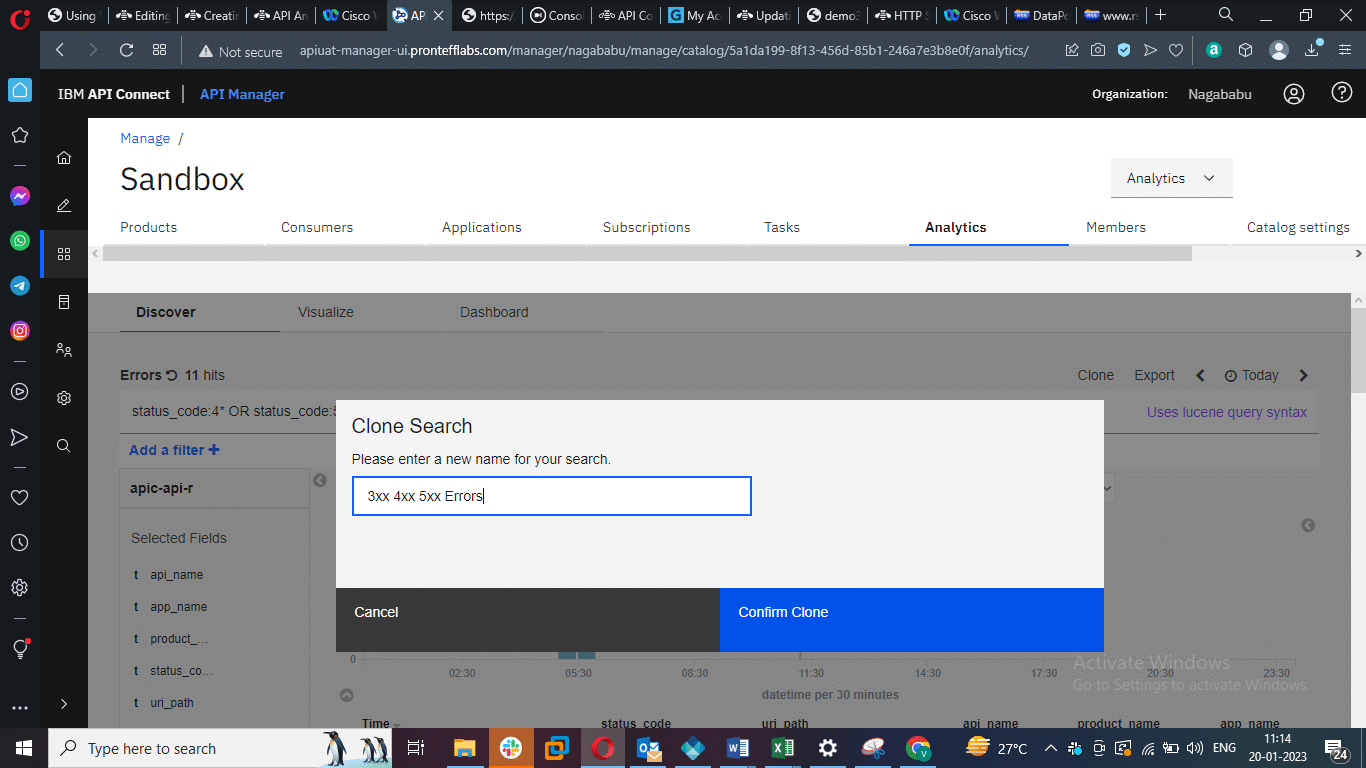
Give the name as ‘3xx 4xx 5xx Errors’ and Confirm Clone.
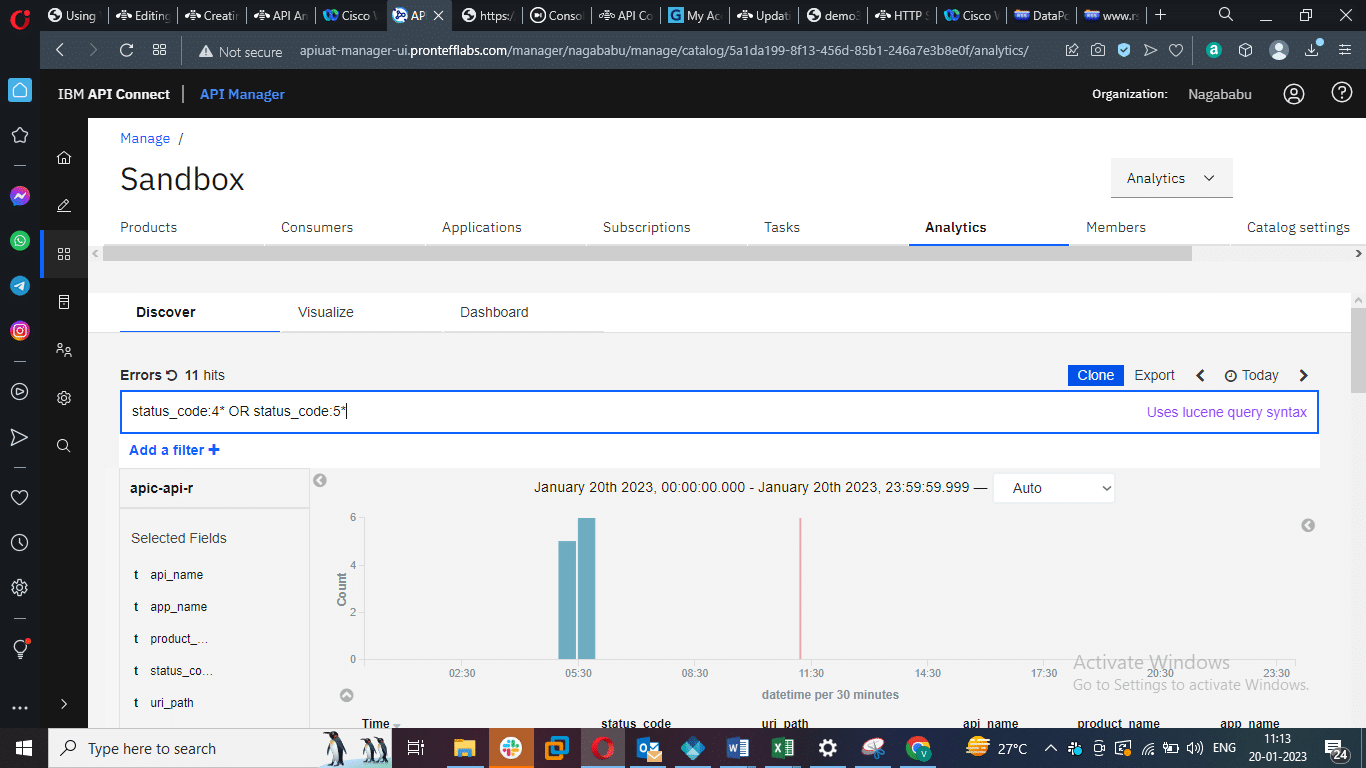
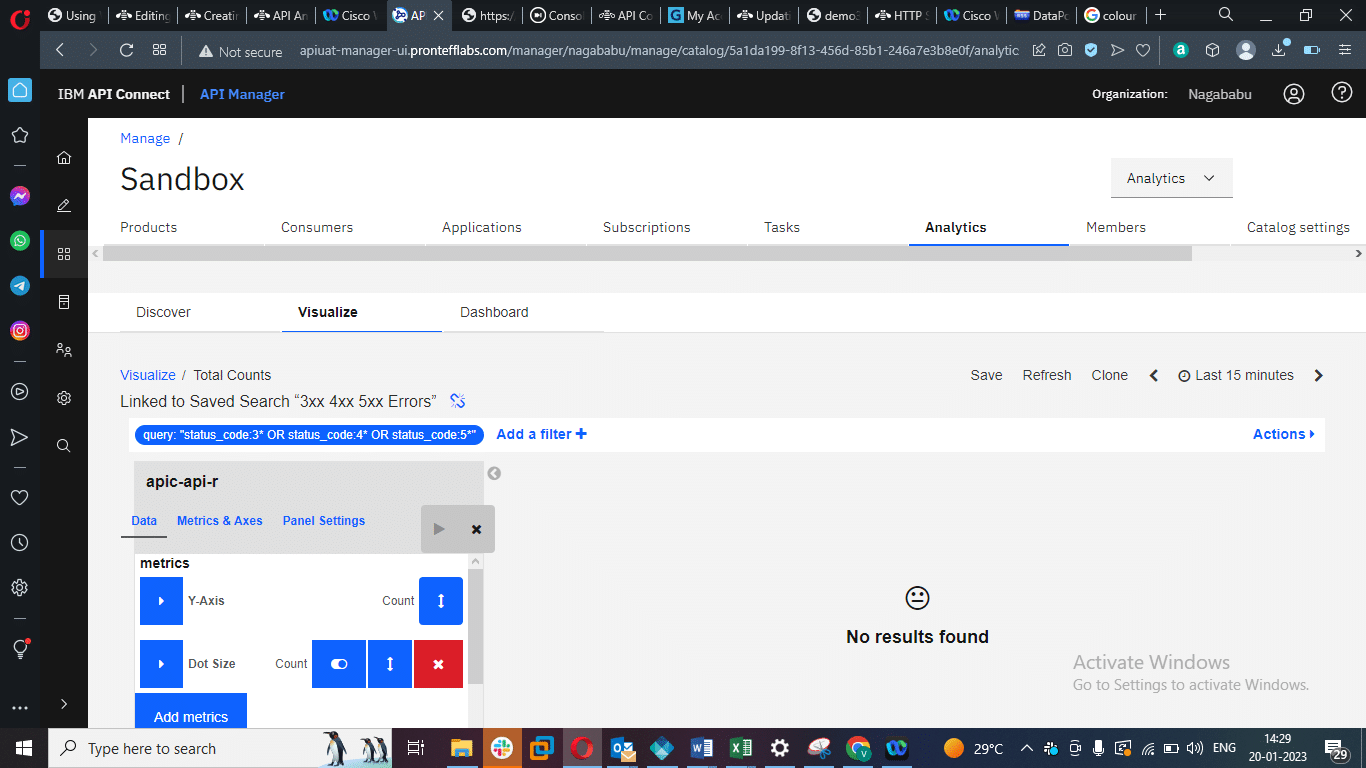
You will find status_code:4* OR status_code:5* in the query syntax field
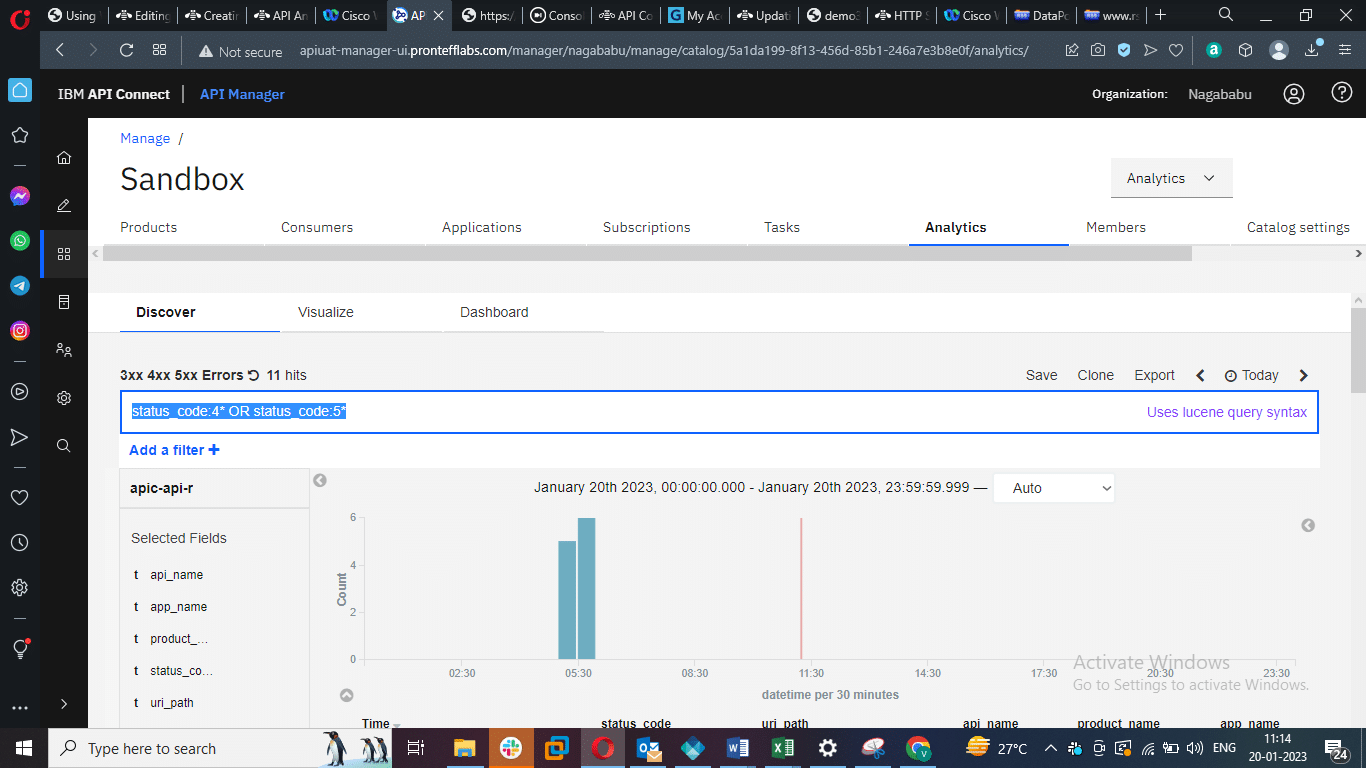
Update it with status_code:3* also.
Click on Save.
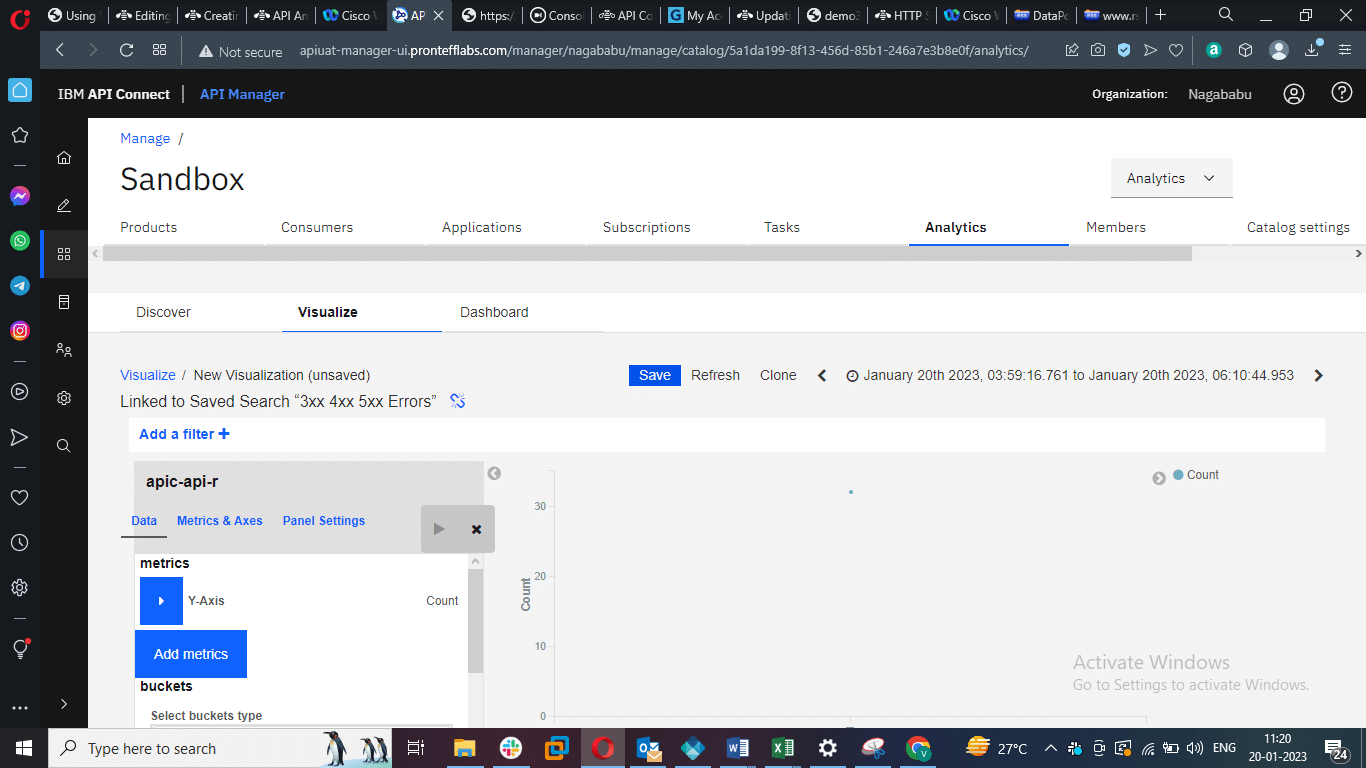
Step 2: Go to Visualize and Click on Add New Visualization.
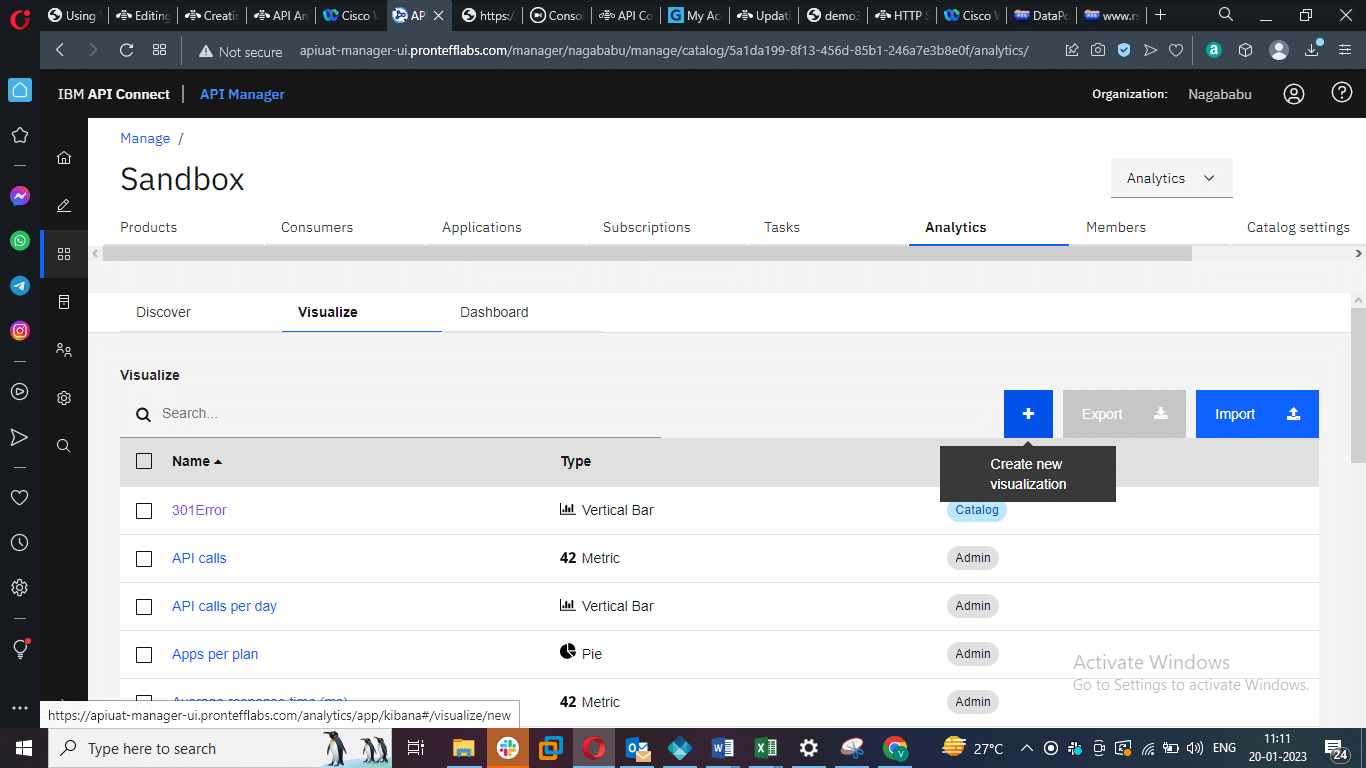
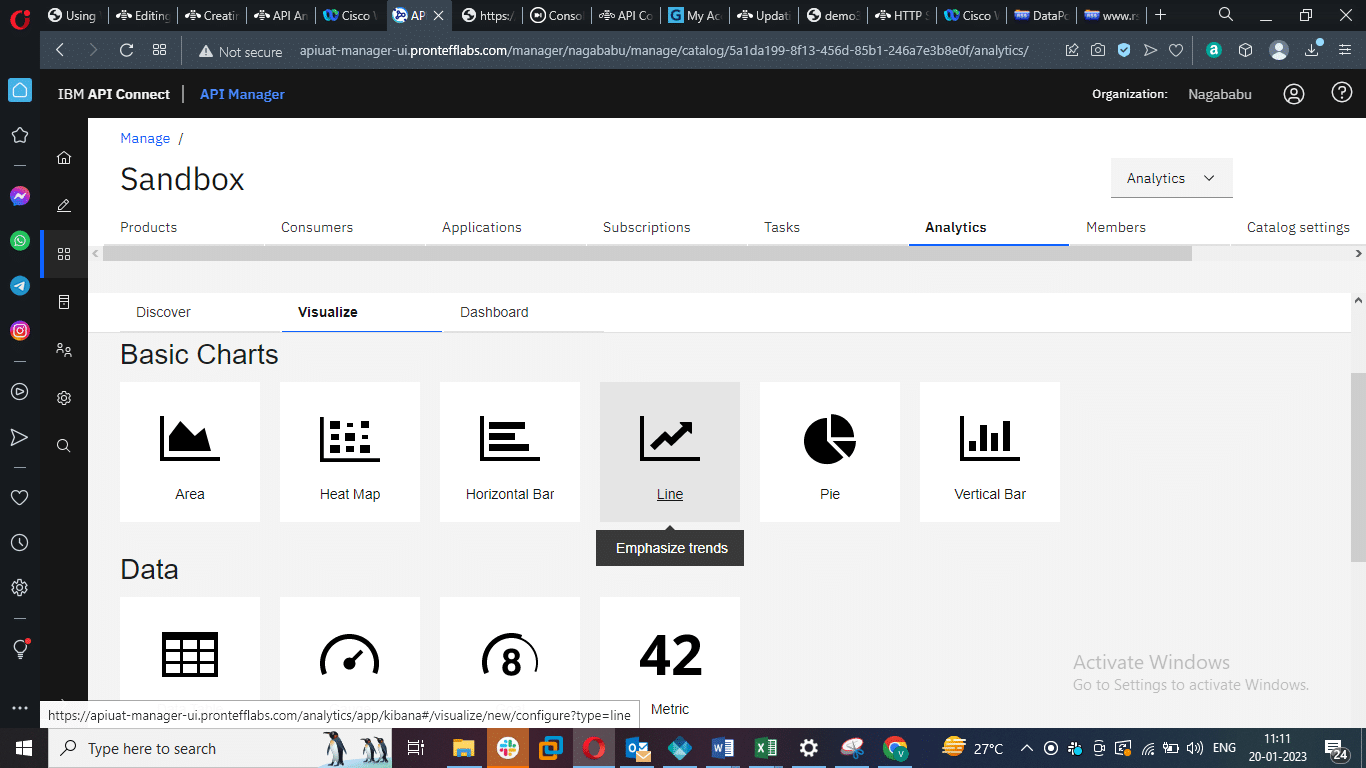
Select the type of Basic Chart.
Select the Created Search Source.
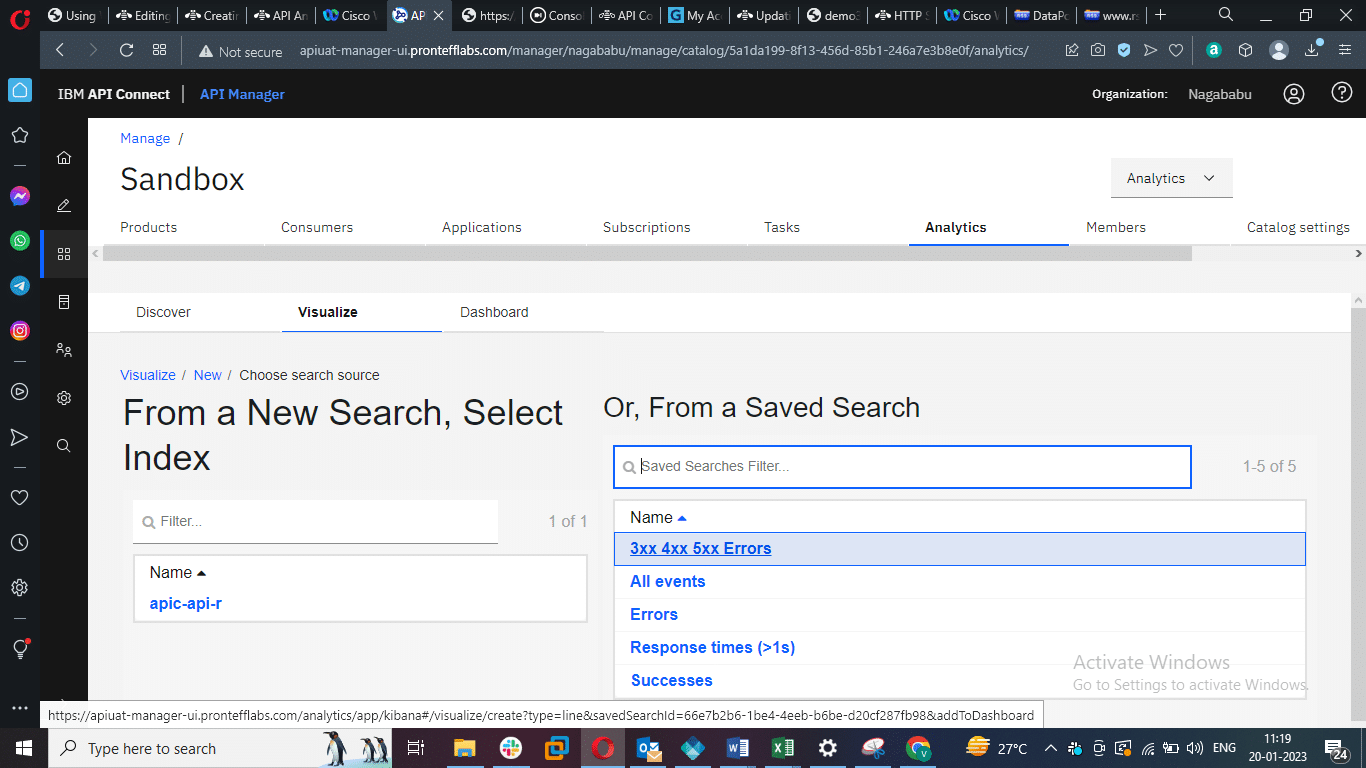
After selecting it give the name of the visualization as “Total Counts” and click on save.
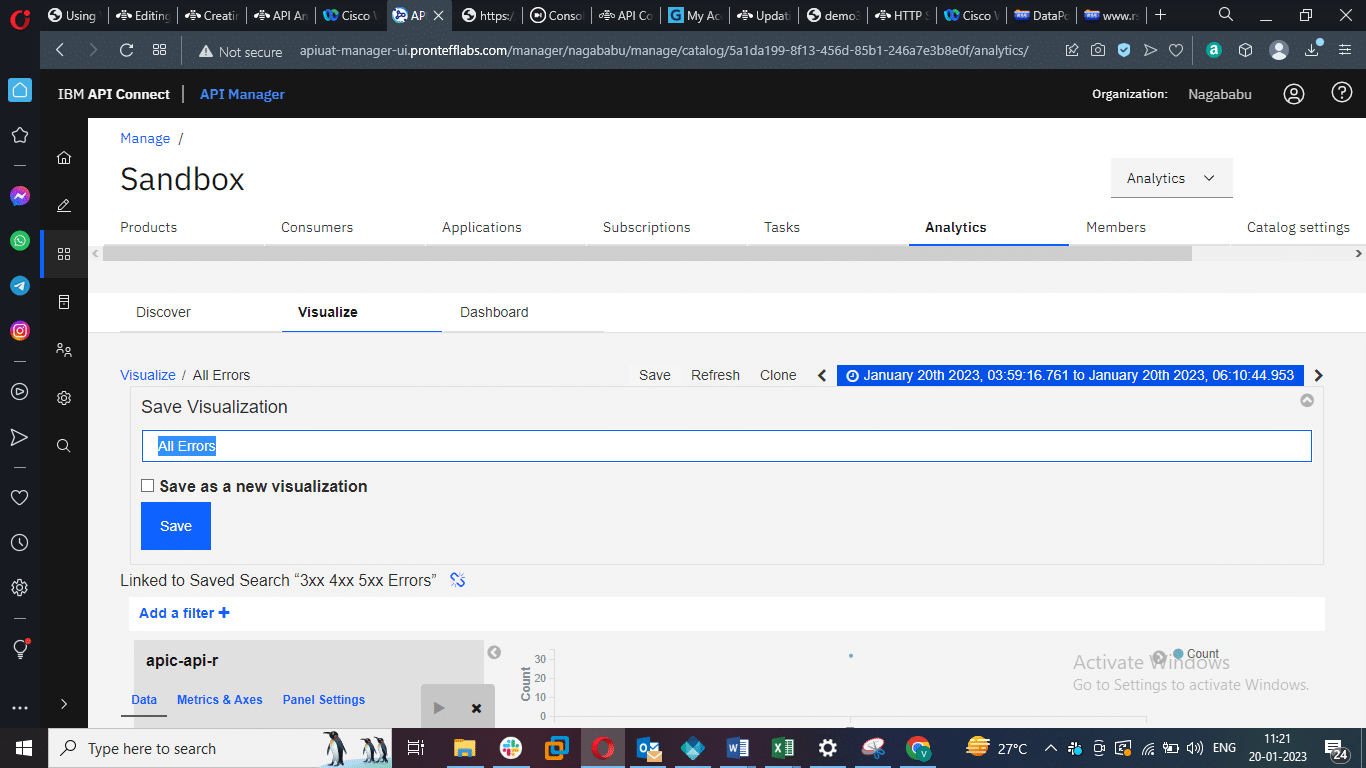
Click on Save on the top left
Step 3: To catch the 3xx errors, we should create a customized Dashboard.
In the default dashboard, go to monitoring status, clone it, and give the name as “Modified dashboard for Monitoring status.”
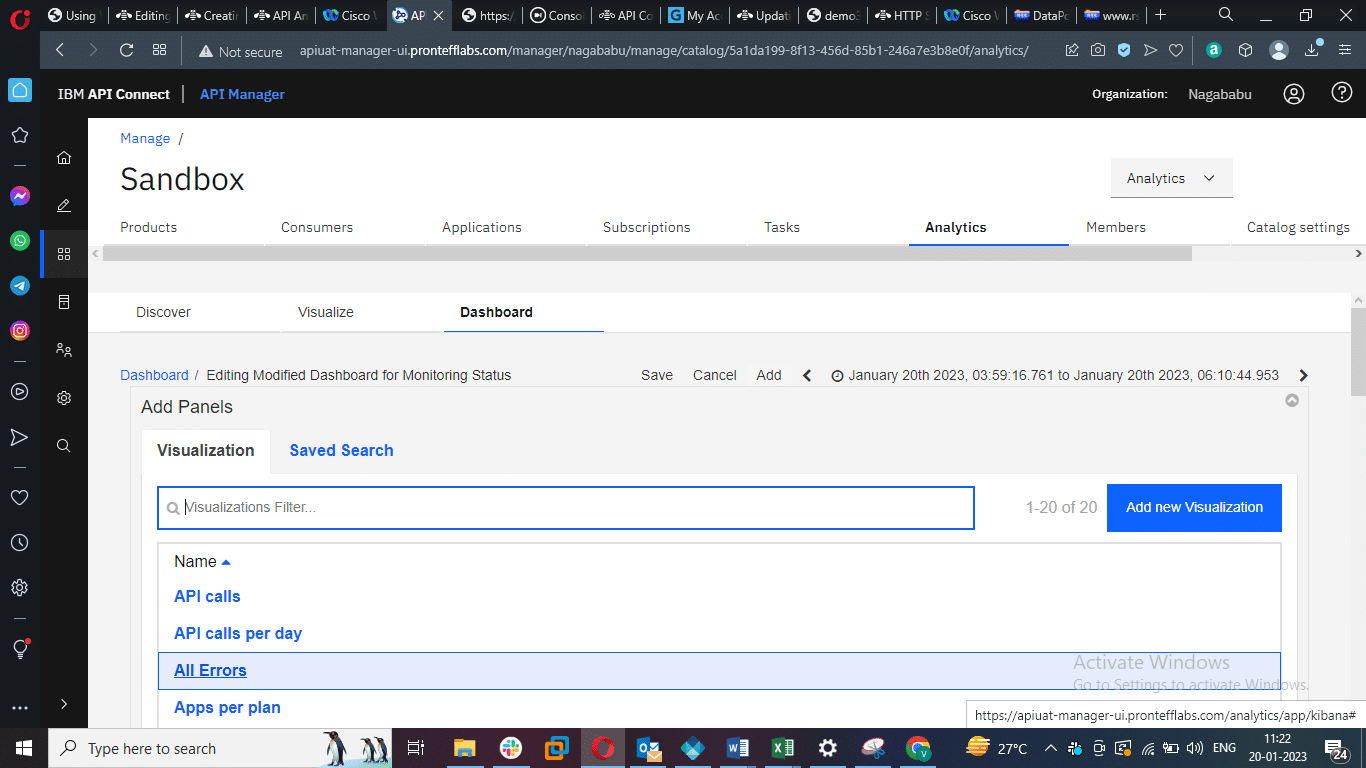
Click on Edit in the top left corner.
 In the Add panels section, select the created Visualization and created saved searched, respectively.
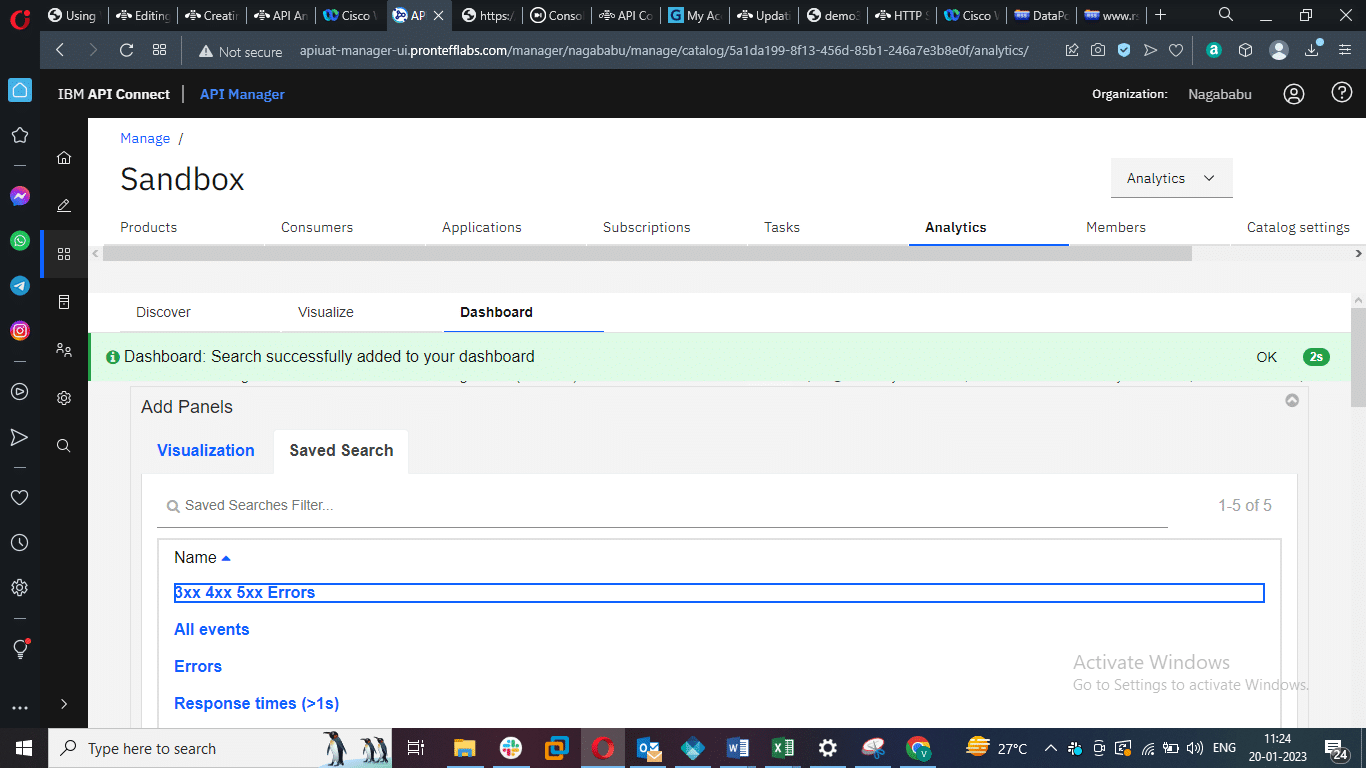
Click on Save.
Then, your dashboard is updated with the added visualizations and searches.
Testing:
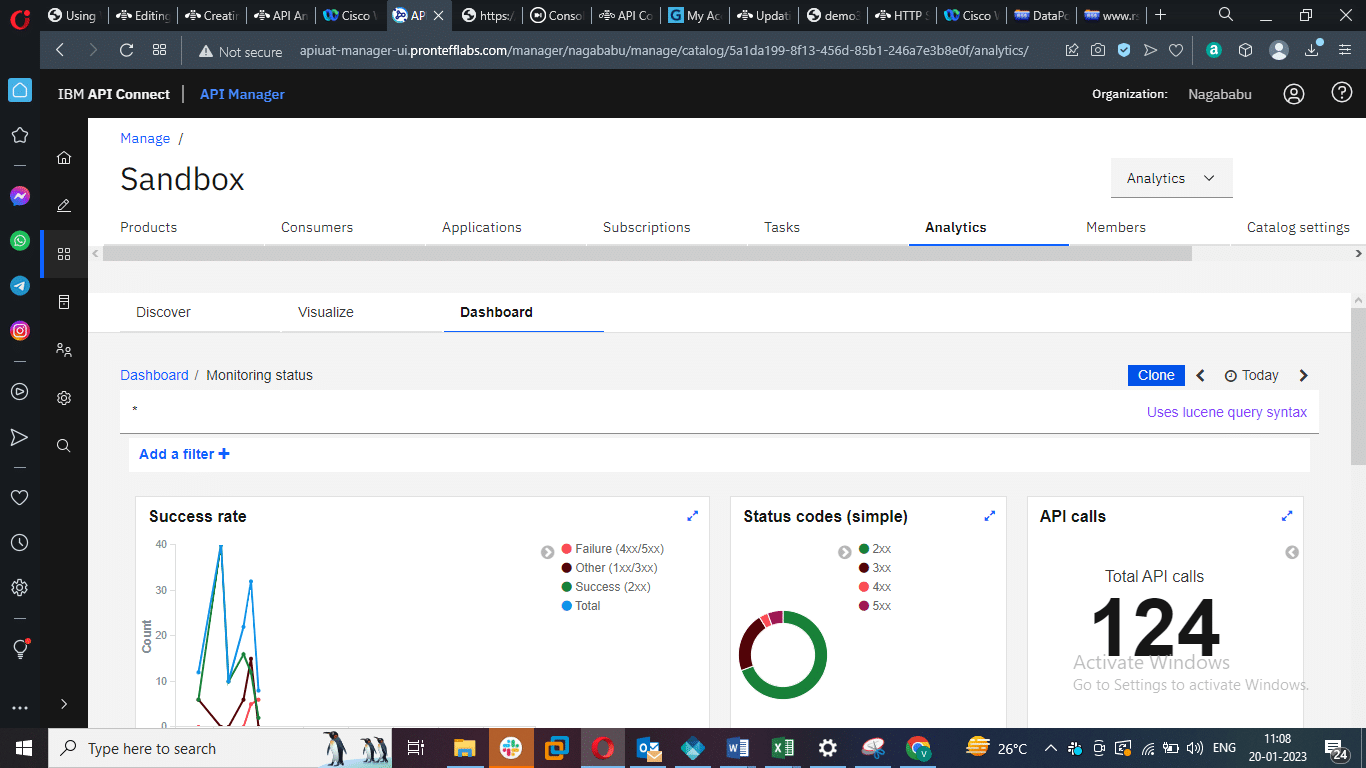
- Consume the APIs that are throwing 3xx Errors and then come to Analytics whether they are captured or not.
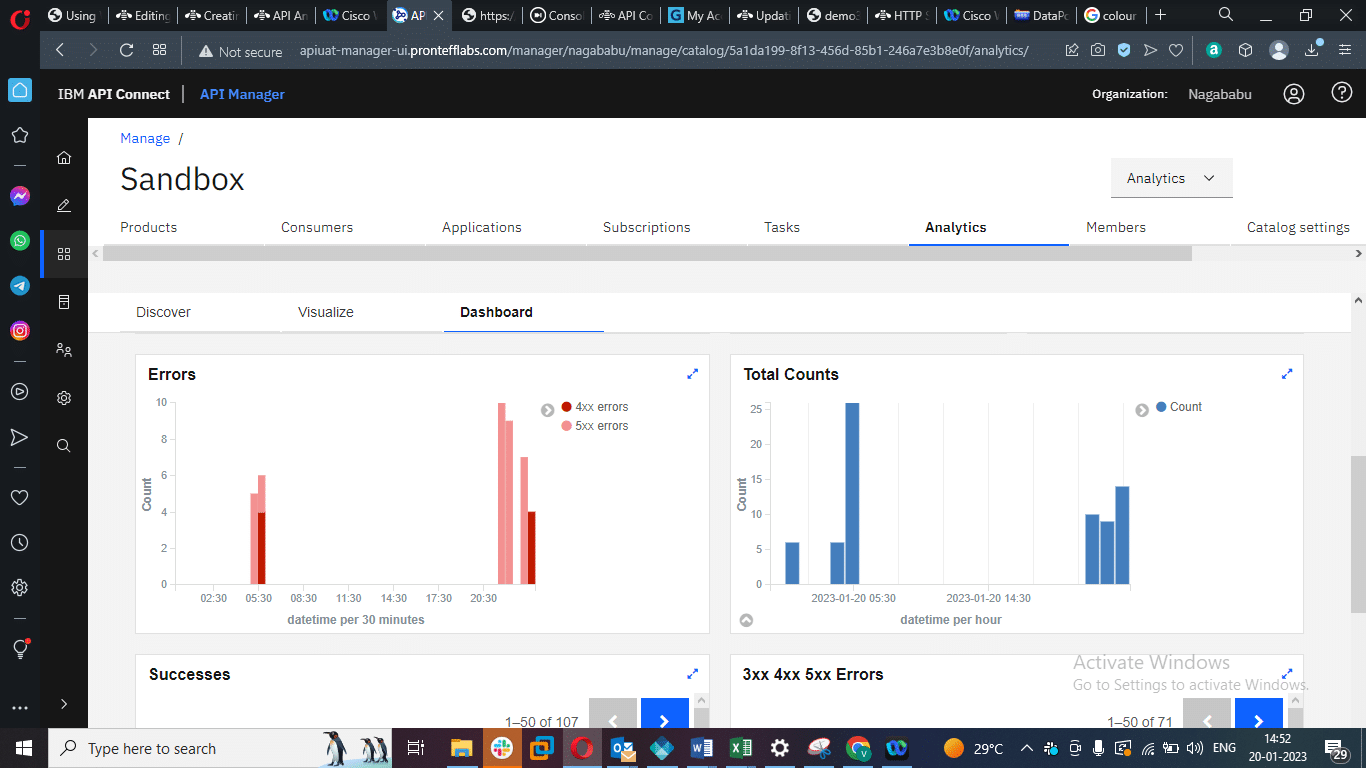
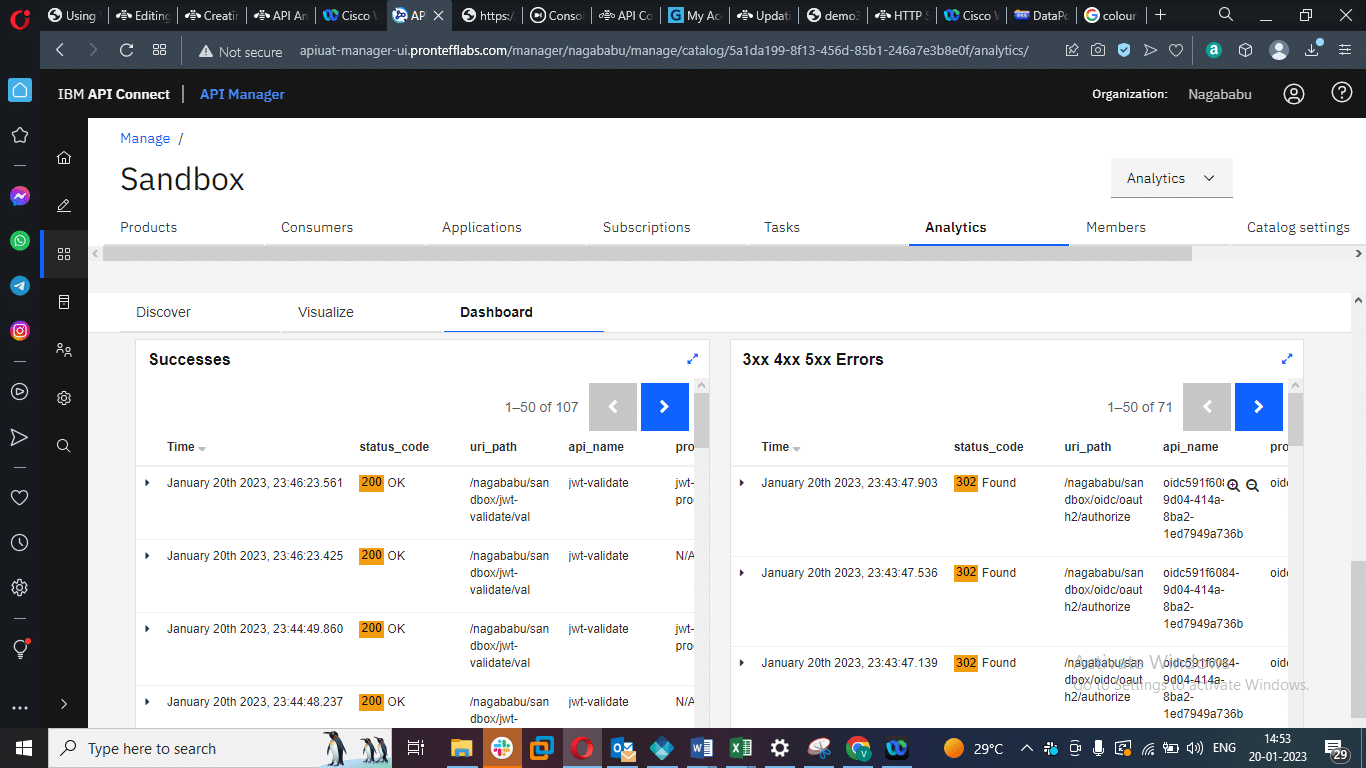
All the 3xx, 4xx, and 5xx status codes are captured here so that we can notice them easily.