

What’s New in Red Hat OpenShift 4.22 Observability.
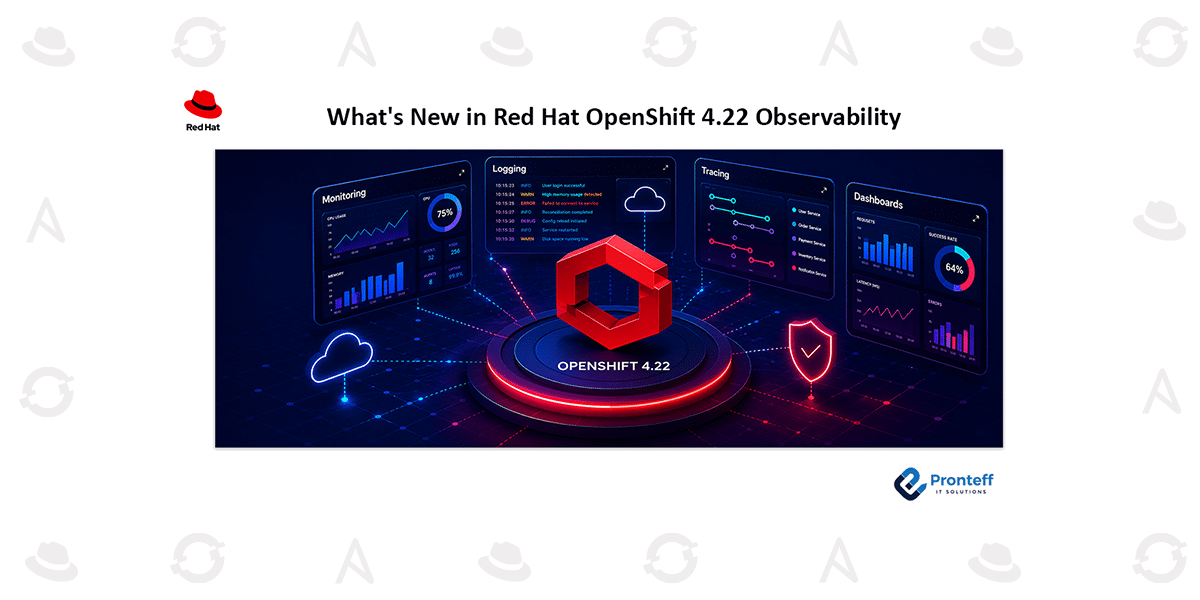
In this blog, we will learn about the key observability enhancements introduced in Red Hat OpenShift 4.22, including smarter monitoring, simplified logging, advanced tracing, and improved dashboarding with the Red Hat build of Perses.
Modern cloud-native environments generate massive volumes of operational data every second. Organizations need more than isolated monitoring tools—they require a unified observability platform that provides complete visibility across applications, infrastructure, and Kubernetes clusters.
Red Hat OpenShift 4.22 introduces significant improvements to its observability capabilities by bringing together metrics, logs, traces, and dashboards into a more integrated ecosystem. The latest release simplifies platform operations, enhances troubleshooting, and helps development and operations teams gain actionable insights faster.
Cluster Observability Operator 1.5 Gets Smarter
One of the key highlights of OpenShift 4.22 is the evolution of the **Cluster Observability Operator (COO) 1.5**. Acting as a centralized management layer, COO deploys and manages dedicated monitoring stacks independently of the platform’s core monitoring services.
Beyond basic monitoring, the operator now includes advanced capabilities such as:
- Intelligent incident detection
- Signal correlation using Korrel8r
- Integrated observability plugins
- Enhanced dashboard management
These additions help organizations manage observability more efficiently while reducing operational complexity.
Red Hat Build of Perses Is Now Generally Available
One of the standout enhancements in this release is the General Availability (GA) of the Red Hat build of Perses. Seamlessly integrated with Cluster Observability Operator (COO) 1.5, Perses delivers a cloud-native dashboarding platform that simplifies the creation, management, and visualization of observability data.
Key capabilities include:
- Native deployment and lifecycle management through COO
- Multi-cluster dashboard visibility using Red Hat Advanced Cluster Management
- OpenShift Role-Based Access Control (RBAC) integration
- GitOps-compatible dashboard management
- Support for Prometheus, Thanos, and existing monitoring data sources
This enables teams to create, manage, and scale dashboards more efficiently while maintaining consistent visibility across multiple clusters.
Why Perses Matters
Traditional dashboard platforms often become difficult to manage as Kubernetes environments expand across multiple clusters.
Perses addresses these challenges by providing:
- Kubernetes-native dashboard definitions
- Declarative configuration management
- High-performance dashboard rendering
- Flexible plugin architecture
- Improved integration with cloud-native monitoring tools
With dashboards treated as code, teams can store configurations in Git repositories, automate deployments through CI/CD pipelines, and maintain version-controlled observability environments.
Simplified Multi-Cluster Visibility
Managing observability across multiple Kubernetes clusters can quickly become complicated.
OpenShift 4.22 simplifies this by allowing organizations to:
- Build reusable dashboards for multiple clusters
- Standardize monitoring across environments
- Minimize duplicate dashboard configurations
- Improve collaboration between developers and SRE teams
This centralized approach helps organizations maintain operational consistency while supporting decentralized application ownership.
Better Experience for Developers and SRE Teams
Perses improves daily operations by enabling Infrastructure as Code practices for dashboards.
Instead of manually configuring visualizations, teams can:
- Define dashboards using YAML
- Store configurations in Git
- Deploy dashboards automatically using CI/CD pipelines
- Ensure consistency across development, testing, and production environments.
The intuitive interface also allows engineers to investigate incidents quickly without sacrificing flexibility.
OpenShift Monitoring Becomes More Reliable
Reliable monitoring forms the foundation of an effective observability strategy.
OpenShift 4.22 introduces several enhancements that improve monitoring accuracy and reduce operational noise.
Improved Monitoring Health Signals
Previous releases occasionally reported temporary cluster health issues during upgrades or infrastructure events, even when services remained healthy.
The latest release significantly reduces these false alerts, providing administrators with more accurate health status and greater confidence during platform upgrades.
Optional Network Interface Monitoring
OpenShift now supports enabling ethtool metrics through the Cluster Monitoring Operator configuration.
This optional feature provides detailed network interface statistics that assist administrators in diagnosing network-related performance issues without requiring unsupported custom configurations.
EndpointSlice Migration
As Kubernetes continues transitioning away from the deprecated Endpoints API, OpenShift 4.22 advances support for EndpointSlices throughout its monitoring ecosystem.
Benefits include:
- Better compatibility with Kubernetes 1.33+
- Reduced deprecation warnings
- Improved monitoring architecture
- Enhanced platform reliability
The Metrics Server has also been strengthened with dedicated client certificates, improving startup reliability and reducing dependency on Prometheus-managed credentials.
Updated Monitoring Components
The monitoring stack receives updated versions of key components, including:
- Prometheus
- Prometheus Operator
- kube-state-metrics
- Thanos
- Alertmanager
- Metrics Server
These upgrades deliver performance improvements, security updates, and important bug fixes that strengthen the overall monitoring platform.
OpenShift Logging Gets Easier and More Secure
Modern logging solutions must be secure, scalable, and simple to deploy.
OpenShift 4.22 introduces major improvements focused on Microsoft Azure integration and streamlined logging deployment.
Native Microsoft Azure Support
With Microsoft retiring the legacy Azure Data Collector API, OpenShift now supports the newer Azure Monitor Logs Ingestion API.
Key improvements include:
OpenTelemetry Protocol (OTLP)
The Cluster Log Forwarder now supports OTLP, providing a vendor-neutral method for forwarding telemetry data to Microsoft Azure while ensuring uninterrupted log collection.
Workload Identity Federation (WIF)
Instead of relying on long-lived shared credentials, OpenShift now supports Workload Identity Federation.
Benefits include:
- Short-lived authentication tokens
- Automatic credential rotation
- Improved cloud security
- Reduced operational risk
One-Click Logging Deployment
Deploying enterprise logging infrastructure is now considerably easier.
Using the ObservabilityInstaller custom resource, administrators can deploy:
- Cluster Logging Operator
- Loki Operator
- Log forwarding configuration
during the initial cluster installation.
This means application and infrastructure logs become available immediately, eliminating lengthy manual setup processes.
Enhanced OpenTelemetry and Distributed Tracing
OpenShift 4.22 also introduces Distributed Tracing 3.10, featuring updated OpenTelemetry components and a newer Tempo Operator for trace storage and analysis.
Several OpenTelemetry components have now reached General Availability.
Probabilistic Sampling
This feature allows organizations to collect a configurable percentage of traces while maintaining statistical accuracy.
Benefits include:
- Lower storage costs
- Reduced compute consumption
- Consistent sampling decisions
Tail-Based Sampling
Rather than making decisions at the beginning of a request, tail-based sampling evaluates complete trace information before determining whether it should be stored.
This results in:
- More accurate trace selection
- Better troubleshooting data
- Lower storage requirements
Kubernetes Objects Receiver
The Kubernetes Objects Receiver captures Kubernetes resources and events, converting them into OTLP-formatted logs for centralized observability.
This enables deeper visibility into Kubernetes object states and cluster events.
Prometheus Remote Write Exporter
This exporter converts collected metrics into Prometheus-compatible time series and forwards them to centralized Prometheus databases.
It is particularly valuable for organizations operating large-scale, multi-cluster monitoring environments.
Improved Tempo Integration
The upgraded Tempo Operator introduces several enhancements, including:
- More accurate metric calculations
- Improved long-term trace analytics
- Enhanced OpenShift OAuth authentication for Grafana users
These improvements simplify secure access while delivering more reliable tracing insights.
Final Thoughts
Red Hat OpenShift 4.22 represents a significant advancement in enterprise observability by bringing monitoring, logging, tracing, and dashboarding into a unified platform. With enhancements like the General Availability of the Red Hat build of Perses, more reliable monitoring, simplified logging deployment, improved Azure integration, and advanced OpenTelemetry capabilities, organizations can manage cloud-native environments with greater efficiency and confidence.
Whether you’re a platform administrator overseeing Kubernetes clusters, an SRE maintaining system reliability, or a developer building cloud-native applications, OpenShift 4.22 provides the tools needed to improve visibility, reduce operational complexity, and accelerate incident resolution.