New features in Red Hat OpenShift Monitoring 4.12 & Logging 5.6
The Five Pillars of OpenShift Observability
The OpenShift Monitoring 4.12 and Logging 5.6 releases place equal emphasis on all five Red Hat OpenShift Observability pillars: (i) Data Collection, (ii) Data Storage, (iii) Data Delivery, (iv) Data Visualization, and (v) Data Analytics. Every day, we strive to provide a seamless, uniform, and streamlined Observability experience across all footprints, including cloud, on-prem, and edge. Let’s look more closely at the features contained in the next versions and what users may anticipate in the following section.
Red Hat OpenShift Observability seeks to provide insights from your data. We are striving to make metrics, traces, and logs easier to gather and store while also aggregating, normalizing, and transporting them in a flexible manner. We are also developing user interfaces that are clear and effective for evaluating the health of your cluster(s).
What are the problems you can now solve with Observability?
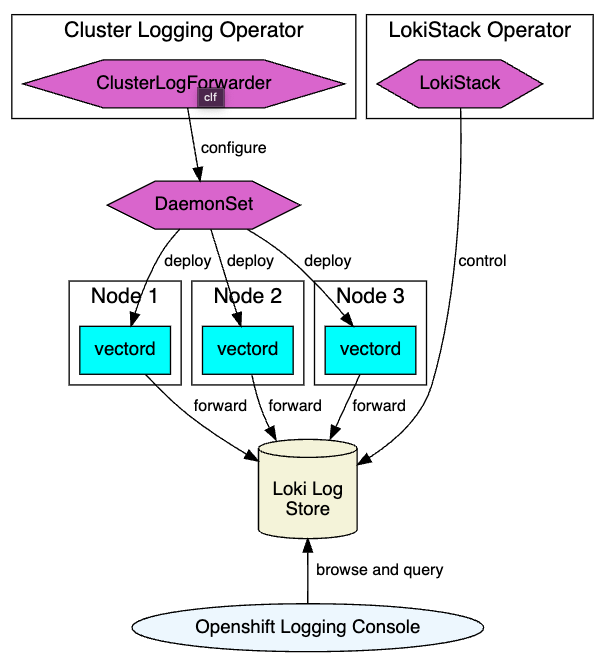
As an alternative to Fluentd in terms of data collection, Vector is now GA with Logging 5.6. Look at our Logging 5.5 release blog for a summary of the advantages of using Vector. Our OpenShift Logging Architecture is further strengthened by Vector, giving users a lot of flexibility (see flowchart below). Vector makes gathering, transforming, and delivering logs, metrics, and events very simple because of its scalability, vendor neutrality, extensive configuration choices, and lower memory consumption.
Thanos Querier is now being used as the backend to obtain metrics for the Prometheus adapter from a monitoring perspective in order to increase data consistency during the collection phase (e.g., Prometheus adapter CPU and RAM time series). Platform Prometheus was employed before. Users would receive metrics from two distinct Prometheus instances as a result of this particular design, and as the metrics did not come from mirrored data, they might have produced different results.
With Logging 5.6, we exposed stream-based retention options in the Loki Stack in relation to data storage. In Loki, stream-based retention has always been postponed to the underlying object storage and has always been global for a cluster. With Loki v2.3.0, retention may be performed through the Loki Compactor, and retention configuration can be enabled for each tenant and stream.
Users now have the opportunity to establish topology spread constraints for Prometheus, Alertmanager, and Thanos Ruler with OpenShift Monitoring 4.12, which enhances the entire Data Storage experience. The protection against node or zone failures is strengthened by having better control over how pods are distributed around users’ clusters. For managing pod scheduling in hierarchical topologies with nodes dispersed over various infrastructure tiers, such as regions and zones inside those regions, pod topology spread constraints are appropriate. Additionally, in some circumstances, you can reduce network latency by scheduling pods in several zones.
Admins can now also develop brand-new alerting rules based on platform metrics, enhancing the management of alert rules, in addition to this capability. The Tech Preview version of this capability is included in OpenShift Monitoring 4.12.
What about data normalization, transportation, and aggregation? You can now take use of the capability offered for passing logs to Splunk thanks to the Logging 5.6 release. In 2022, we added support for the CloudWatch log forwarding add-on, supporting STS installations, in addition, to supporting forwarding logs to Google Cloud Logging. With the addition of these features, the Logging Data Delivery experience as a whole becomes more adaptable for users and their use cases.
With OpenShift 4.12, logs may now be examined from the Developer Perspective of the OpenShift Web Console from a Data Visualization standpoint. You can rapidly locate cluster-related issues by searching, filtering, and visualizing logs under the Observe > Aggregated Logs tab (s). To make it easier to find logs, predefined filters like pod and container have also been included.
Along with these new logging features, we now support Alertmanager’s negative matchers for muting alarms on the OpenShift Web Console. Users of the Web Console now have more options when it comes to handling silences.
Additionally, we continue to work on enhancing user navigation with each version. Users of the Web Console can now use runbooks URLs for alerts with ease thanks to OpenShift 4.12’s Alerting UI. This means that users will be able to quickly resolve issues if an alert contains a runbook url label. Users can do this by clicking on the alert and accessing the runbook information. In a nutshell, this new functionality reduces the amount of time needed for debugging tasks, enabling interactive data analytics. Additionally, from the perspective of logging, you can now additionally include the OpenShift cluster-ID in log entries to uniquely identify clusters in aggregated logs, enhancing your data controller.
What are we planning next for Observability?
In order to gradually move away from siloed observability pillars, we are aiming to emphasize each of Red Hat Observability’s five pillars. Although we recognize the value of offering a customized Observability experience, flexibility remains the key to success. We are increasing the possibilities for third-party integration because of this.
In addition to forming relationships, we want to get the most out of every observable signal. We are working on a number of projects to make this happen, such as offering log-based alerts and improving the Dashboards UI in the OpenShift Web Console. In a nutshell, we intend to provide a 360-degree OpenShift Observability experience, in which all observability pillars are mutually supportive.
Do you like to know more details about our roadmap? Do you require further details on how to use Observability to open the Pandora Box? Are you curious to learn more about career options in data visualization and analytics? Please do not hesitate to contact Red Hat’s Field Organization for additional details and support, or send us an email if you have any queries about the planned features. Keep checking back for additional posts, and welcome to our new OpenShift Observability adventure!