Using Grafana and APIs to build custom queries for observability
In this blog, We discuss how this use case could be expanded to include custom metrics for applications that offer these metrics or third-party infrastructure components. Additionally, how to use an API and Grafana to query these custom metrics that RHACM is unaware of.
Understanding and gaining insight into your environment require monitoring. To gain that insight into all of your clusters, Red Hat Advanced Cluster Management for Kubernetes (RHACM) is a good tool. Utilizing the RHACM observability service, you may instantly obtain crucial metrics from all of your clusters with no additional work.
The observability service is enabled when a cluster, sometimes referred to as the hub cluster, is imported into RHACM. RHACM then deploys agents on the managed cluster that gather all the metrics and send them to the hub cluster. Grafana allows you to view these metrics, and you can also build custom dashboards for it or use an API to query it.
Prerequisites
On your Red Hat OpenShift Container Platform 4 cluster, you must install RHACM and turn on the observability service. Import one cluster as well into your hub cluster.
Enabling custom metrics in Red Hat Advanced Cluster Management
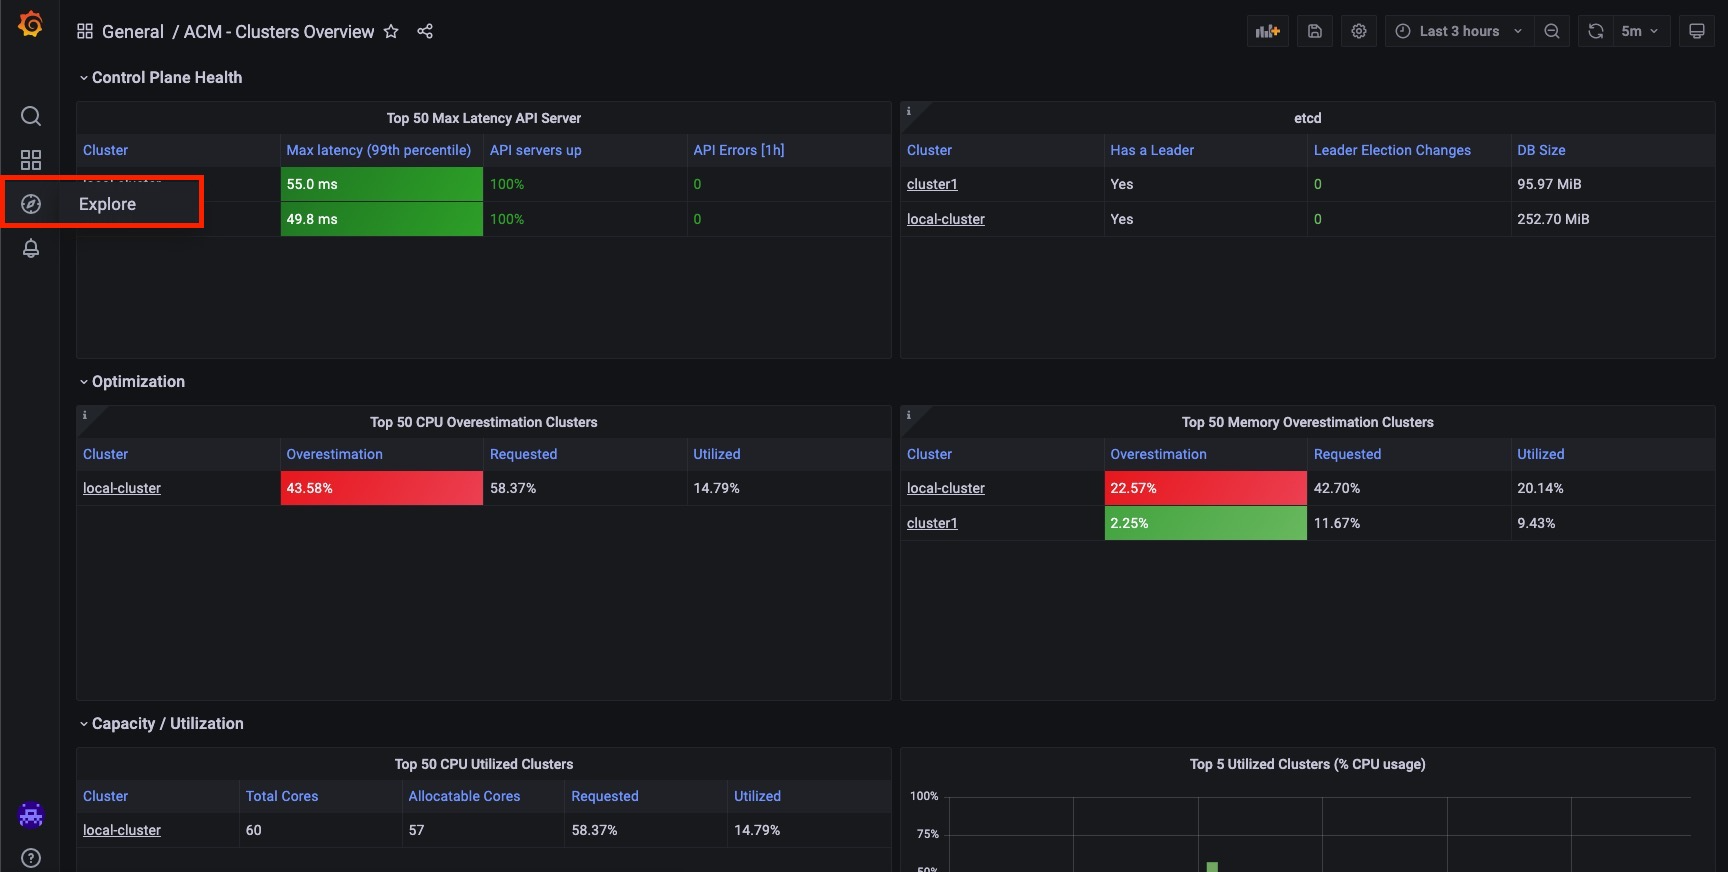
Grafana is a wonderful tool for viewing metrics and even creating dashboards based on them. Since not everyone is familiar with the metrics offered, you can create your own Prometheus queries using Grafana’s explore functionality in order to observe the data.
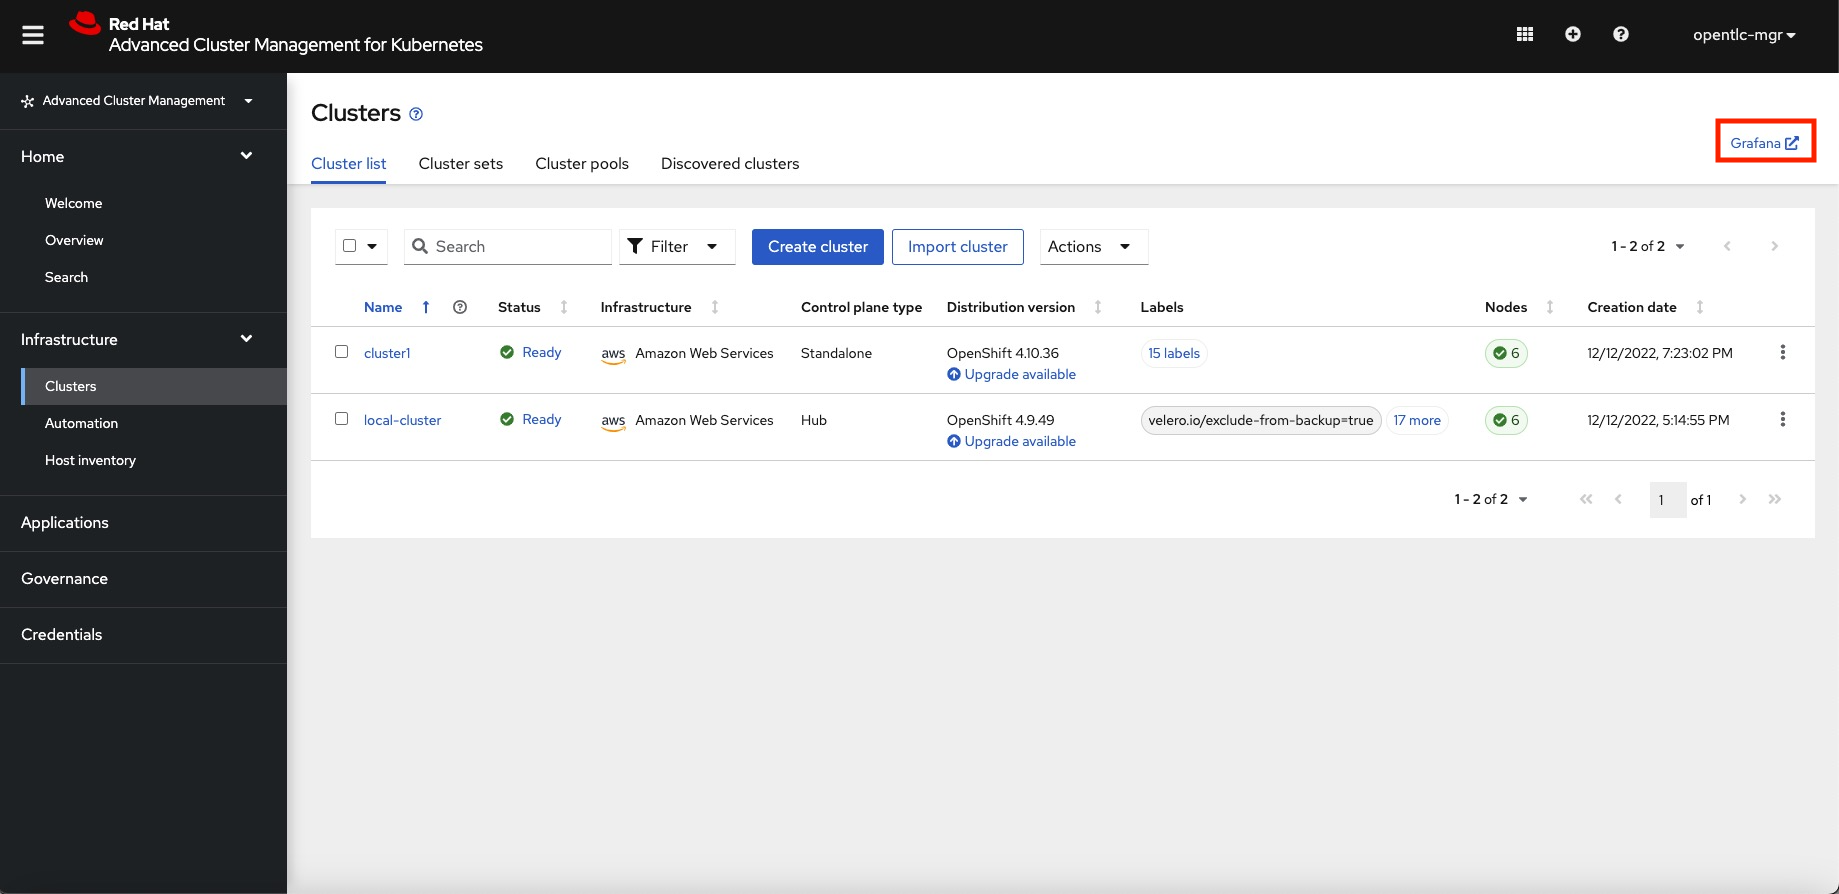
Launch the Grafana instance after logging into RHACM by clicking the link for it on the Clusters page. The below images show the Grafana dashboard:
Create your Prometheus queries using the explore option on the Grafana dashboard. Look at the image below:
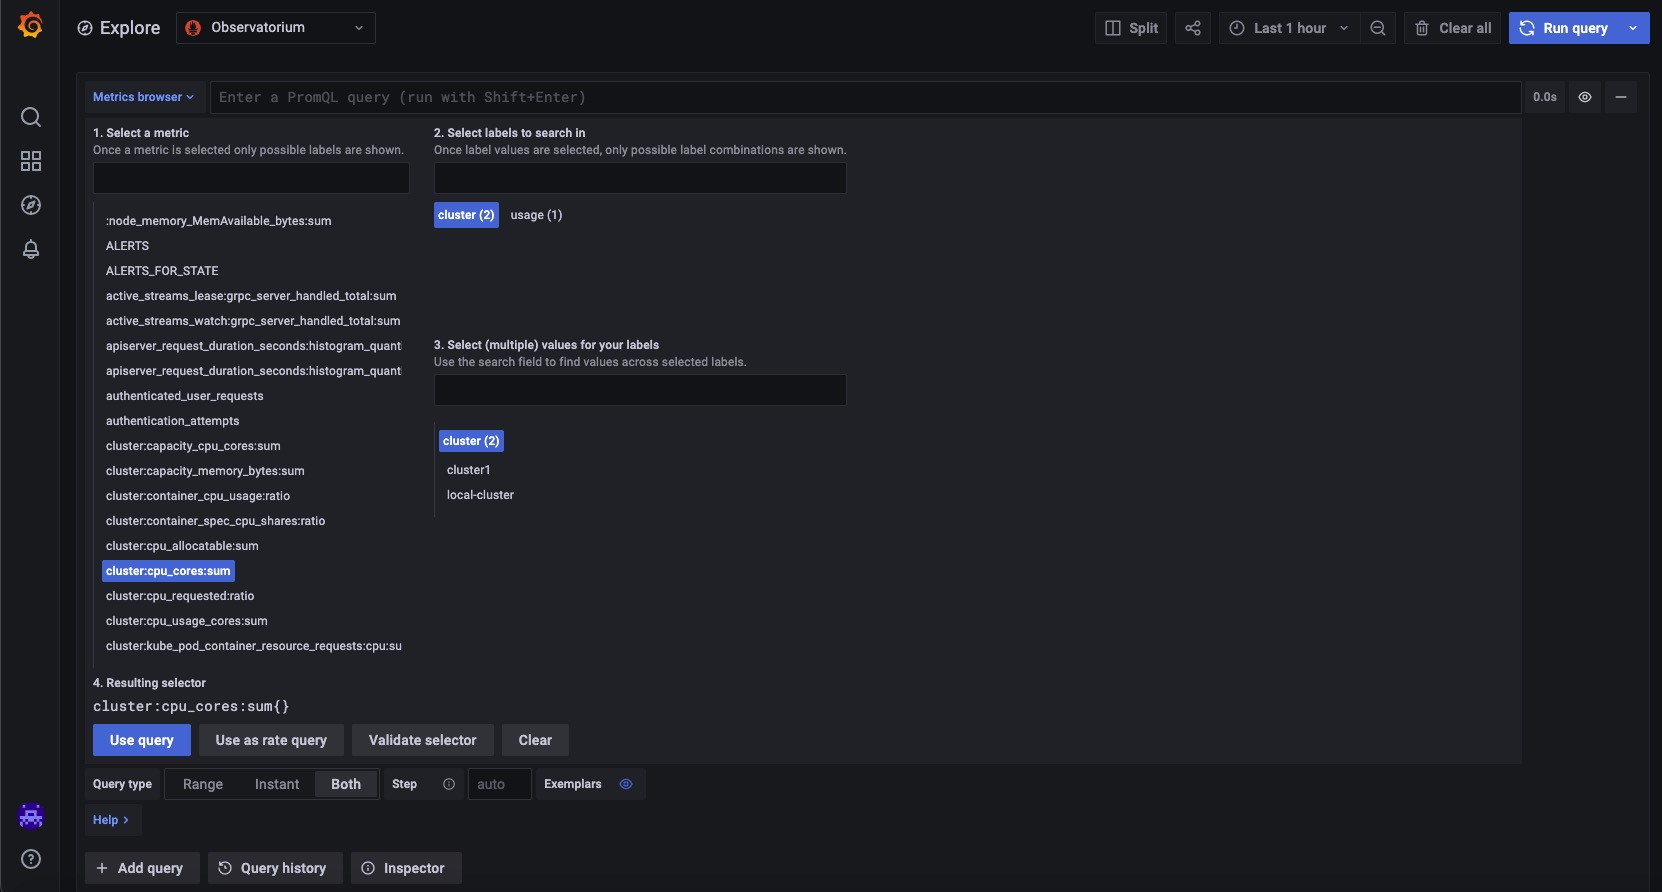
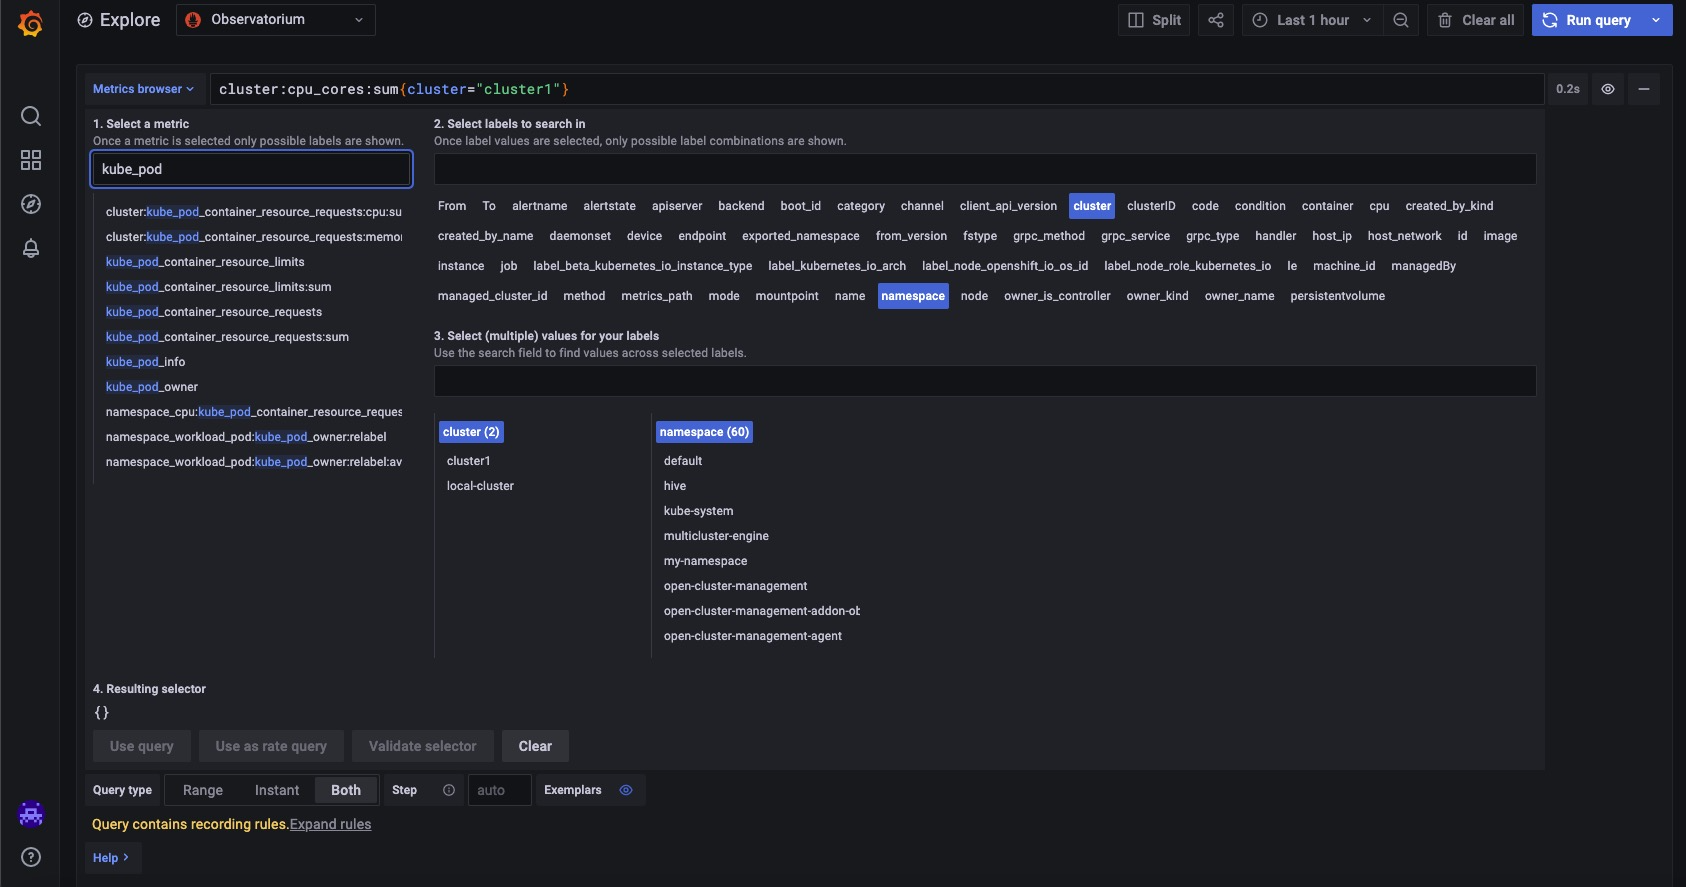
Notice that some of the queries that RHACM offers are right out of the box from the Explore page, which is located after the Metrics Browser. Let’s look at one that displays the total number of CPU cores a cluster has available. Put in the following: cluster:cpu cores:sum. Pick the cluster I imported into my RHACM cluster, cluster-1, from the list of clusters:
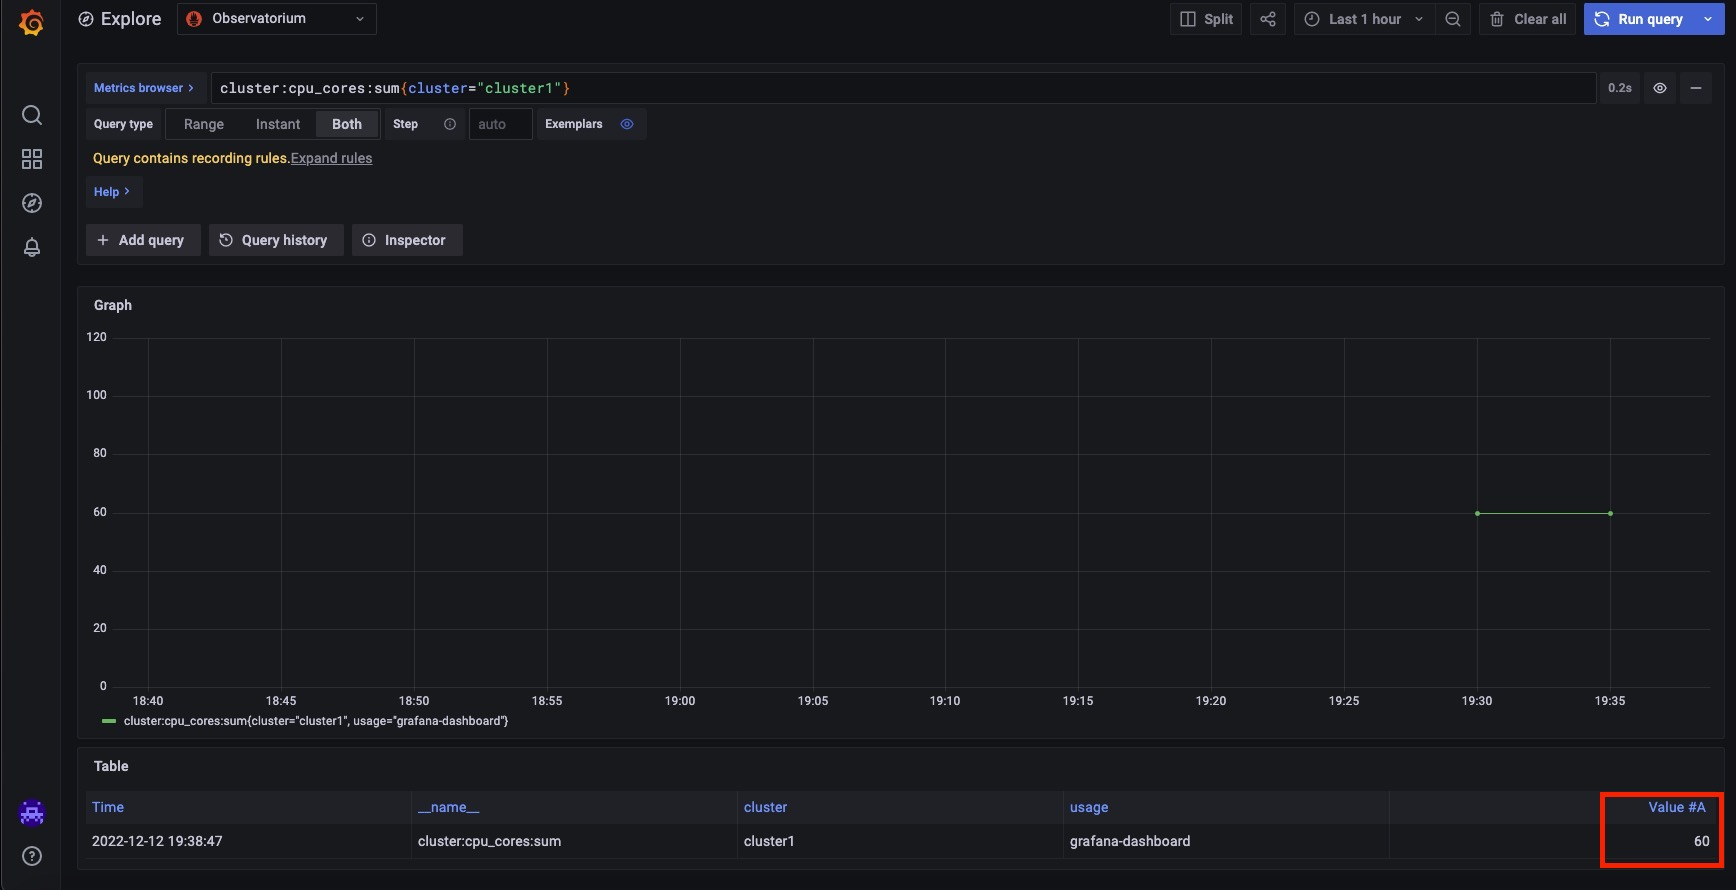
We can use the query to see all of the cores in one of my managed/remote clusters once we have chosen this cluster. Observe that my remote cluster has a total of 60 cores in the following image:
Although these out-of-the-box queries are excellent, there are situations when custom queries must be used since the out-of-the-box options are not enough.
A ConfigMap named observability-metrics-allowlist in the open-cluster-management-observability namespace contains a list of RHACM’s permitted queries.
We may query these metrics because Prometheus and a number of exporters are included by default with OpenShift Container Platform 4. All of these are not automatically found by RHACM. Let’s learn how to create a new ConfigMap with certain metrics to be found.
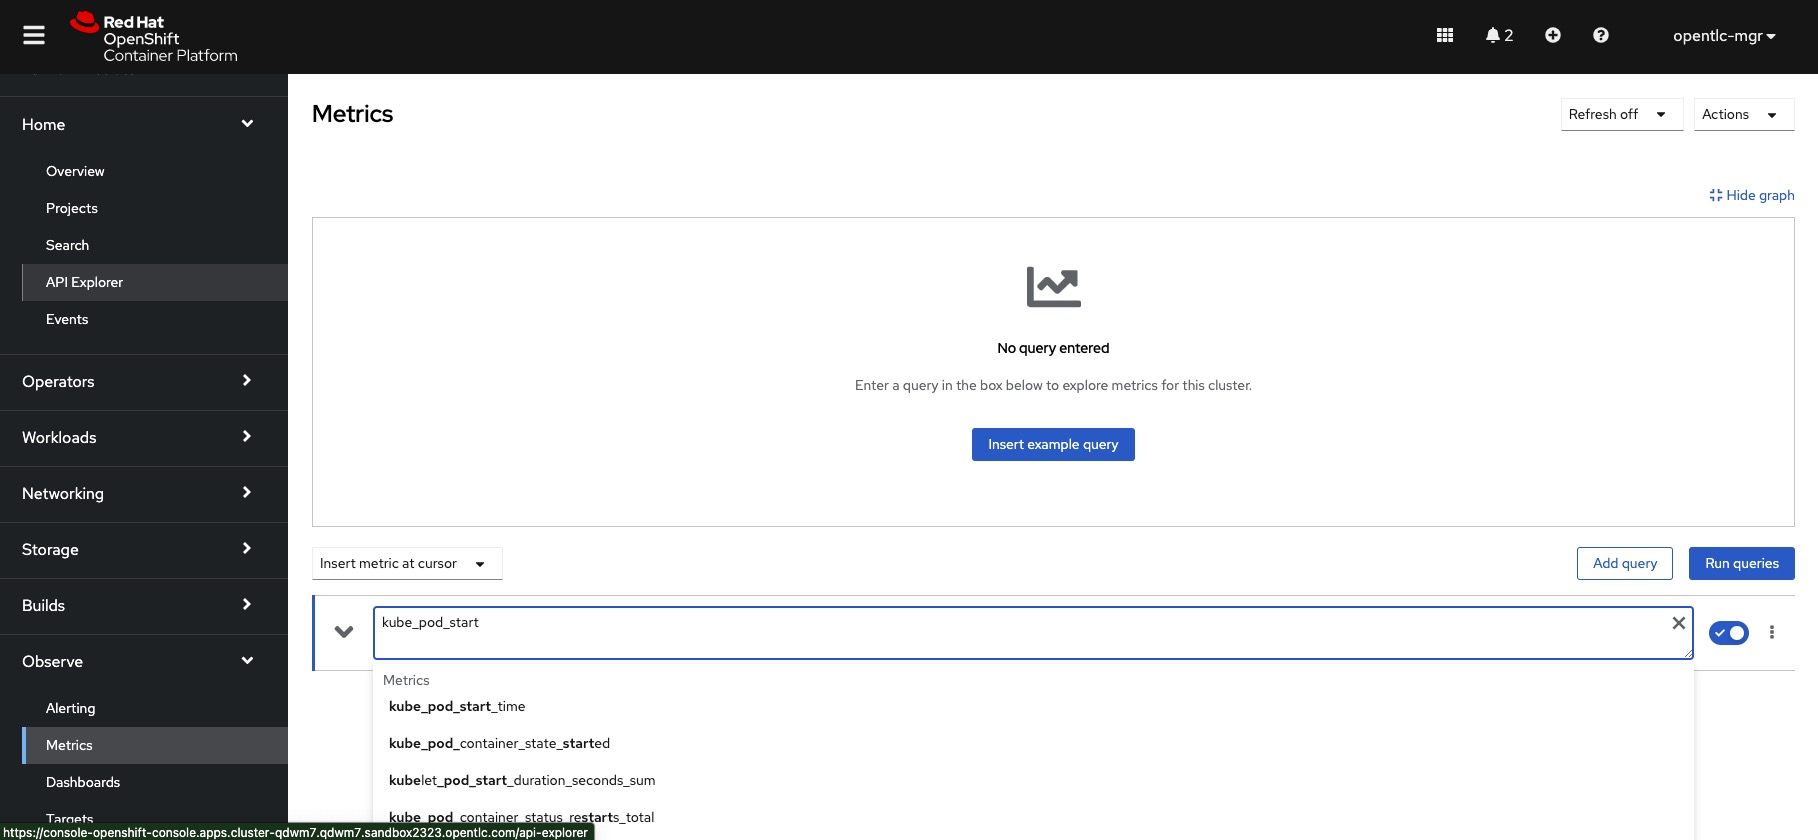
The Kubernetes API server listens to the OpenShift Container Platform 4 installation of kube-state-metrics, an open-source project that produces metrics about the status of the objects. Kube pod start time, which reports the UNIX timestamp of a pod’s creation, is one of the metrics that it exposes. Let’s try using Grafana to locate this metric:
Grafana does not support the metric, as seen in the above image. I can see this statistic is available, though, if I log in to my remote cluster and use the Observe tab to look for these metrics. View the following image:
A custom-allowlist must be made to find these metrics in order to enable them in RHACM and display them in Grafana. To accomplish this, you must add the kube_pod_start_time metric to a ConfigMap in the open-cluster-management-observability namespace named observability-metrics-custom-allowlist.yaml. Your ConfigMap may look something like this:
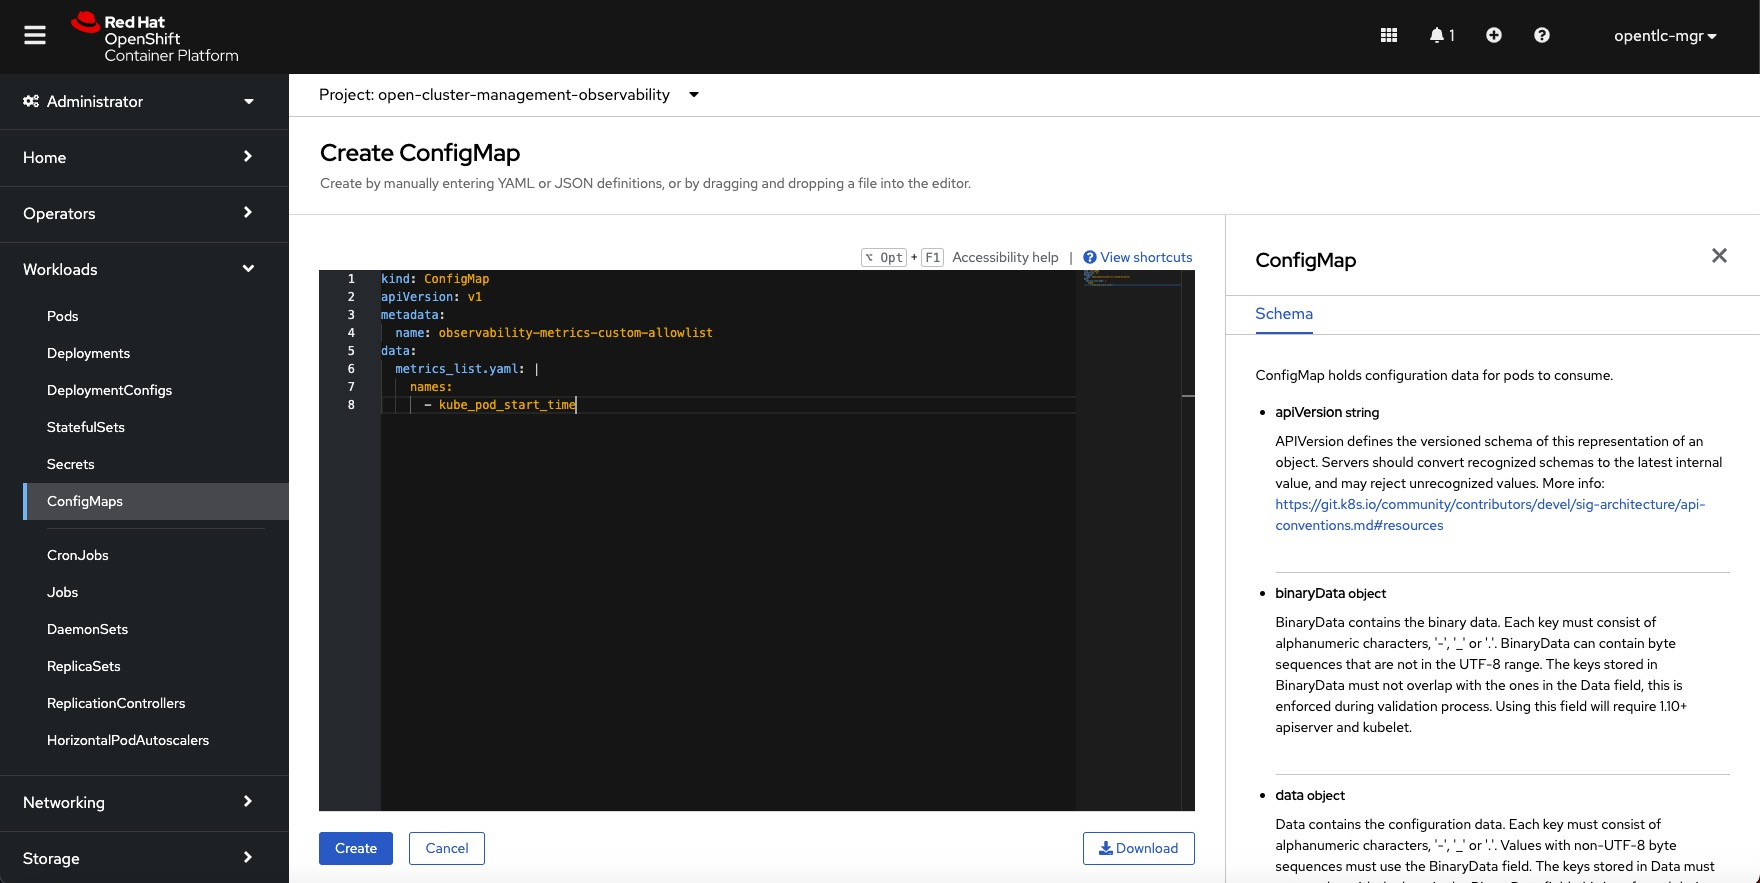
The metric may now be found via the Grafana console and used to create a Prometheus query when this has been established. It may be necessary to reload the Grafana web console:
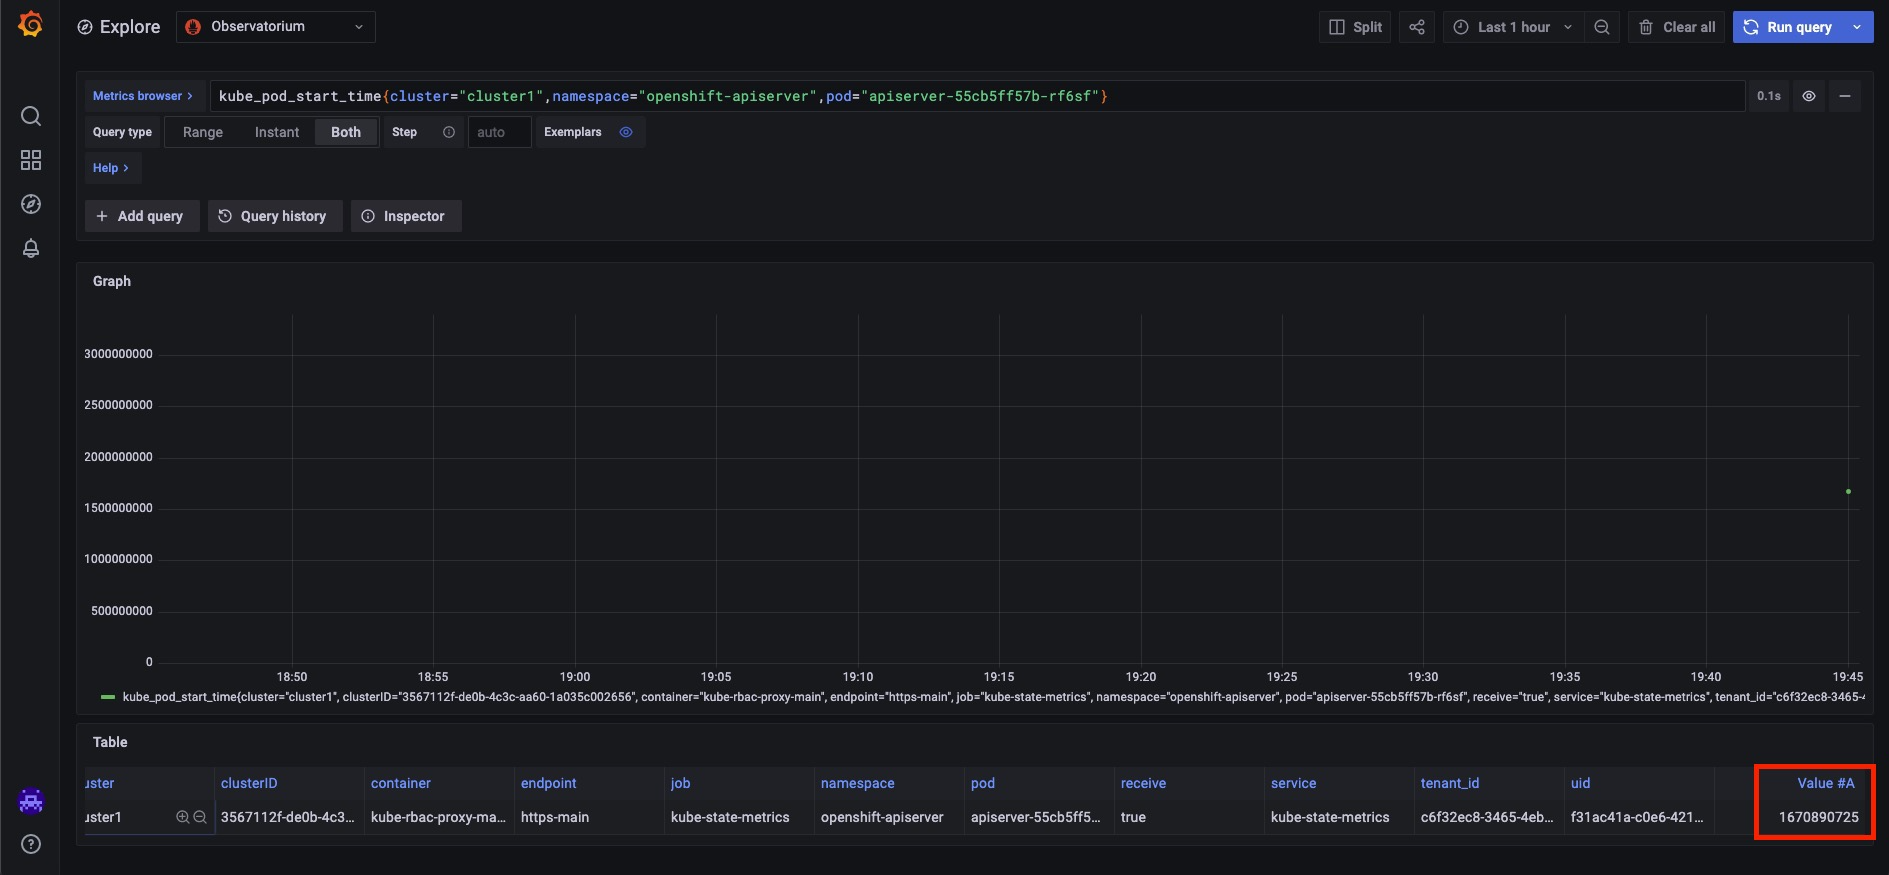
To obtain the timestamp of the pod’s creation, you can now query any pod in any cluster that RHACM manages. It is possible to convert this Unix epoch timestamp format into a human-readable one.
Enabling third-party custom metrics in RHACM
It’s great to enable metrics that are already present in the remote clusters, but what if you want to query metrics for a component that is not automatically monitored? Consider the case when you already have a deployed application that exposes specific metrics. This application is not monitored by Prometheus of the OpenShift Container Platform by default. Enabling the user-workload-monitoring service is the most effective way to keep an eye on this application. RHACM versions 2.6 and earlier do not, as of the time of writing this blog, pull metrics from any more Prometheus instances. The Prometheus platform is the best place to monitor the application.
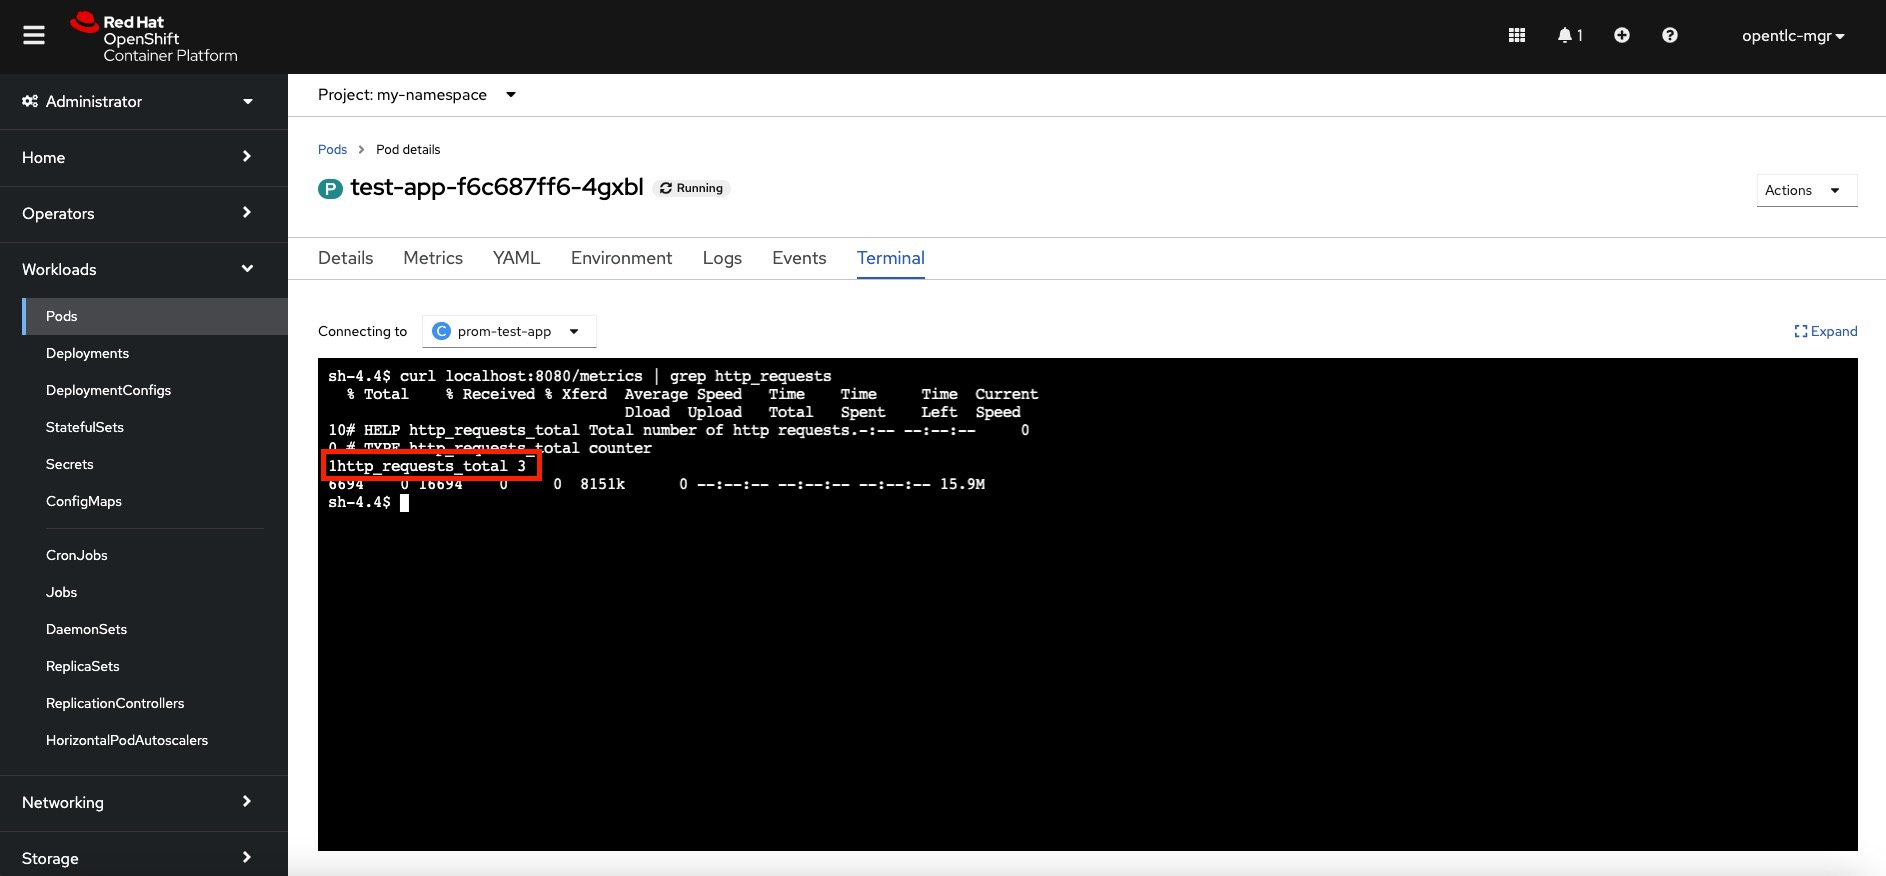
I have a sample Go application that counts the number of HTTP requests it has received and exposes HTTP metrics. In addition to the application manifests, you require a ServiceMonitor and a service that keeps track of the pods’ metrics endpoints. You can find the manifests for this application in my git repository here. You must construct the Role and RoleBinding, which specify that the Prometheus-k8s service account in the openshift-monitoring namespace watches your application metrics, in order to allow the Prometheus platform to monitor your application. Your service monitor must also be installed in the openshift-monitoring namespace.
All of the manifests that are included in the git repository can simply be applied. You can now query the statistic from the pod after the app has been deployed. Look at the image below:
You can see that the Prometheus platform is now keeping track of your namespace and scraping the metrics from the pods that expose them on the Metrics page. View the ensuing image:
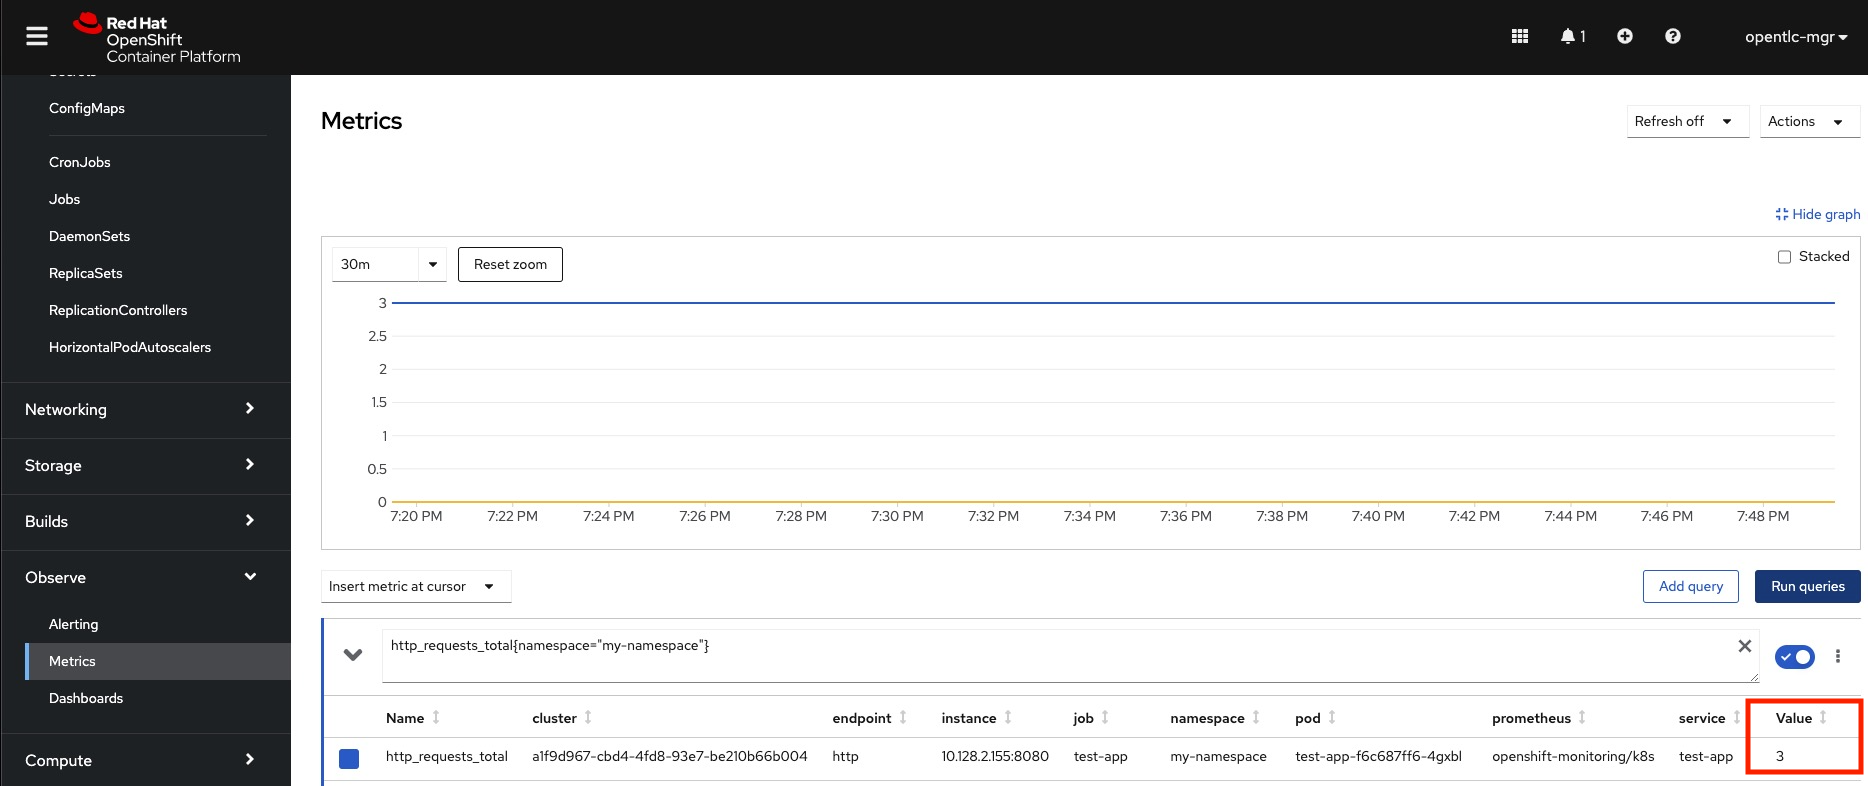
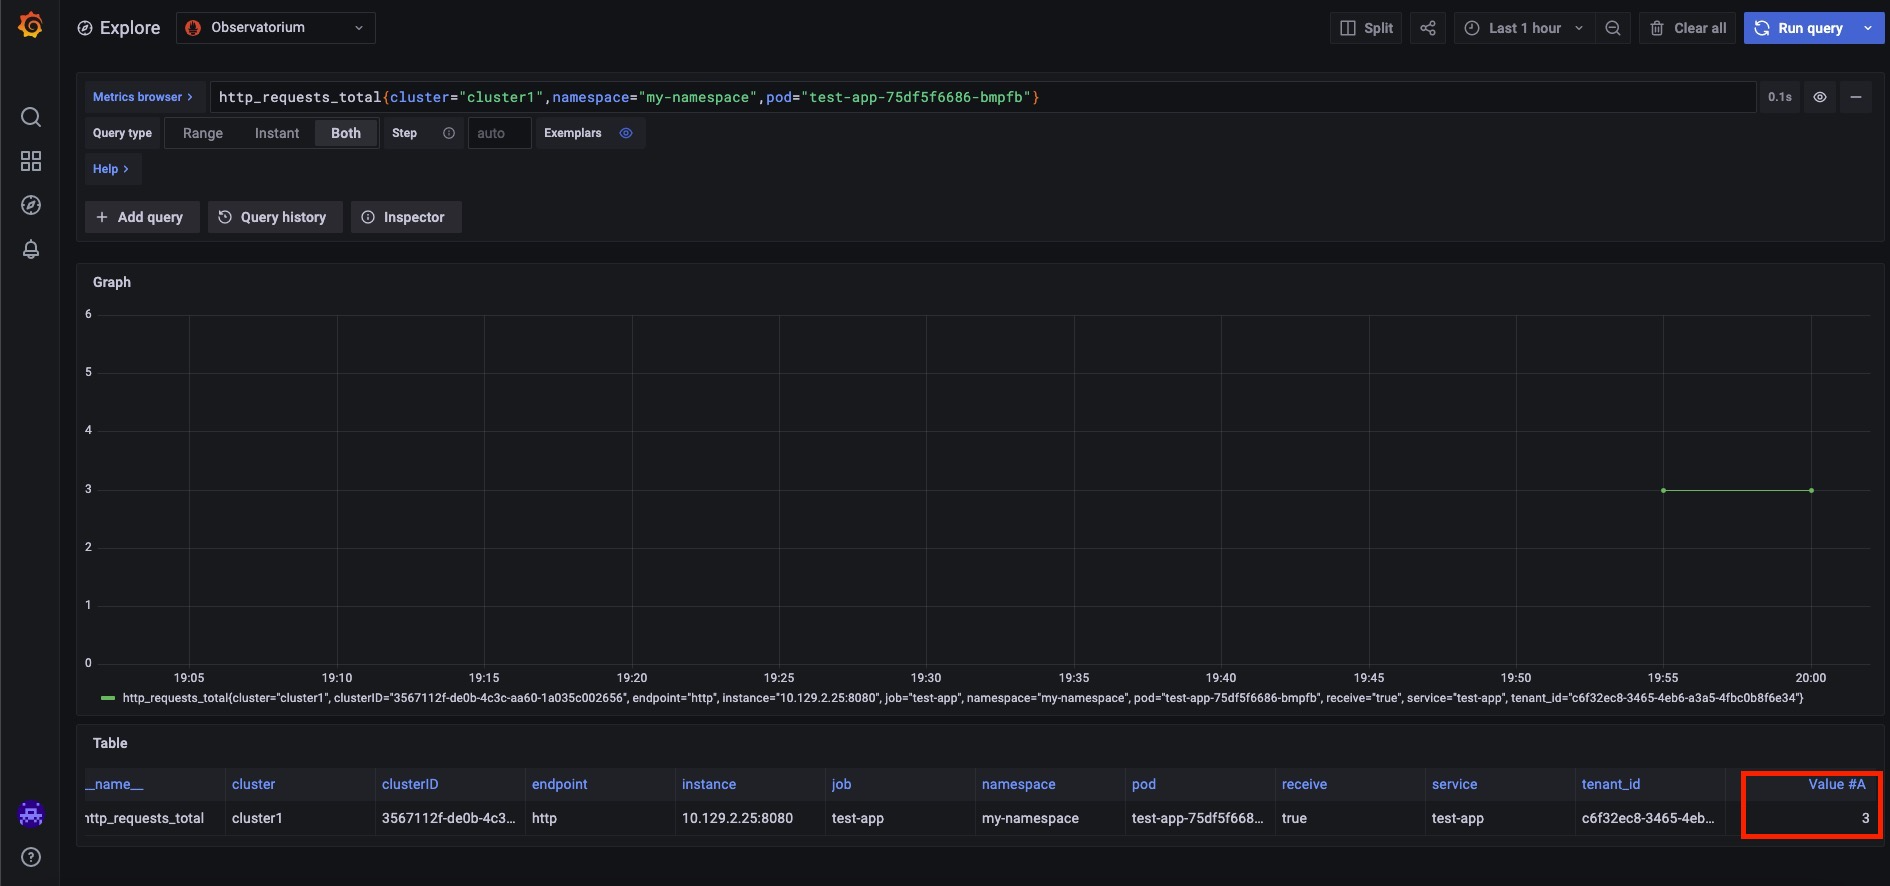
The metrics are available on the local cluster, as indicated in the above image. The metrics must be added to the custom-allowlist as previously explained if RHACM does not permit the metrics in the observability-metrics-allowlist ConfigMap. The custom metrics are automatically sent to RHACM once you add them to the ConfigMap. You should now be able to conduct Prometheus queries against the metric on the RHACM hub cluster and see it in Grafana. Look at the image below:
Querying metrics using an API
Now, this test application has its own custom metrics in addition to numerous other platform metrics. Let’s go over how to use an API to query the metrics. You can utilize a route that RHACM provides to execute Prometheus queries. Your RBAC access to RHACM is also taken into account by this route. The following command can be used to get this route:
oc get route rbac-query-proxy -n open-cluster-management-observability
To query against this route, you need an authentication token, which you can get through the CLI once you’ve logged in to the cluster as a cluster-admin. Run the command line:
oc whoami -t
As it was previously mentioned in this blog, you can also create the queries in Grafana Explorer and then use the same query to pass to the proxy route URL. Use these instructions:
$ curl -H "Authorization: Bearer {TOKEN}" https://{PROXY_ROUTE_URL}/api/v1/query -d ‘query={QUERY_EXPRESSION}’
$ curl -H "Authorization: {TOKEN}" https://{PROXY_ROUTE_URL}/api/v1/query -d 'query=http_requests_total{namespace="my-namespace", pod="test-app-f6c687ff6-ph4zg"}'

{"status":"success","data":{"resultType":"vector","result":[{"metric":{"__name__":"http_requests_total","cluster":"cluster-1","clusterID":"8a12a38f-435d-4c87-8c67-b07a3b661605","endpoint":"http","instance":"10.128.2.36:8080","job":"test-app","namespace":"my-namespace","pod":"test-app-f6c687ff6-ph4zg","receive":"true","service":"test-app","tenant_id":"e4912c5f-5da3-4ecd-86c9-c94fed121394"},"value":[1664853315.762,"6"]}]}}
Using jq filtering, make the query more specific:
$ curl -H "{TOKEN}" https://{PROXY_ROUTE_URL}/api/v1/query -d 'query=http_requests_total{namespace="my-namespace", pod="test-app-f6c687ff6-ph4zg"}' | jq '.data.result[0].value[1]'
"6”
To obtain additional queries, you can query this API. Let’s imagine you want to know when your pods started utilizing the newly added custom metric. Run the command line:
$ curl -H "{TOKEN}" https://{PROXY_ROUTE_URL}/api/v1/query -d 'query=kube_pod_start_time{cluster="cluster-1",namespace="my-namespace"}’
The search for the CPU usage of pods during the previous 15 minutes is another well-known query. Run the command line:
$ curl -H "{TOKEN}" https://{PROXY_ROUTE_URL}/api/v1/query -d 'query=sum(rate(container_cpu_usage_seconds_total{cluster="cluster-1",namespace="my-namespace",container!=""}[15m]))' | jq
{
  "status": "success",
  "data": {
    "resultType": "vector",
    "result": [
      {
        "metric": {},
        "value": [
          1664854512.906,
          "0.00023315520027097773"
        ]
      }
    ]
  }
}
Summary
You can create complicated inquiries and one-of-a-kind questions using this mix of querying with the API and constructing queries from Grafana. These queries can be quite useful for gathering important data about your clusters as well as data from external components operating on clusters that RHACM is managing. A data scientist can conduct analytics on this data to find patterns and identify abnormalities by calling the API provided in this blog from a Jupyter notebook.