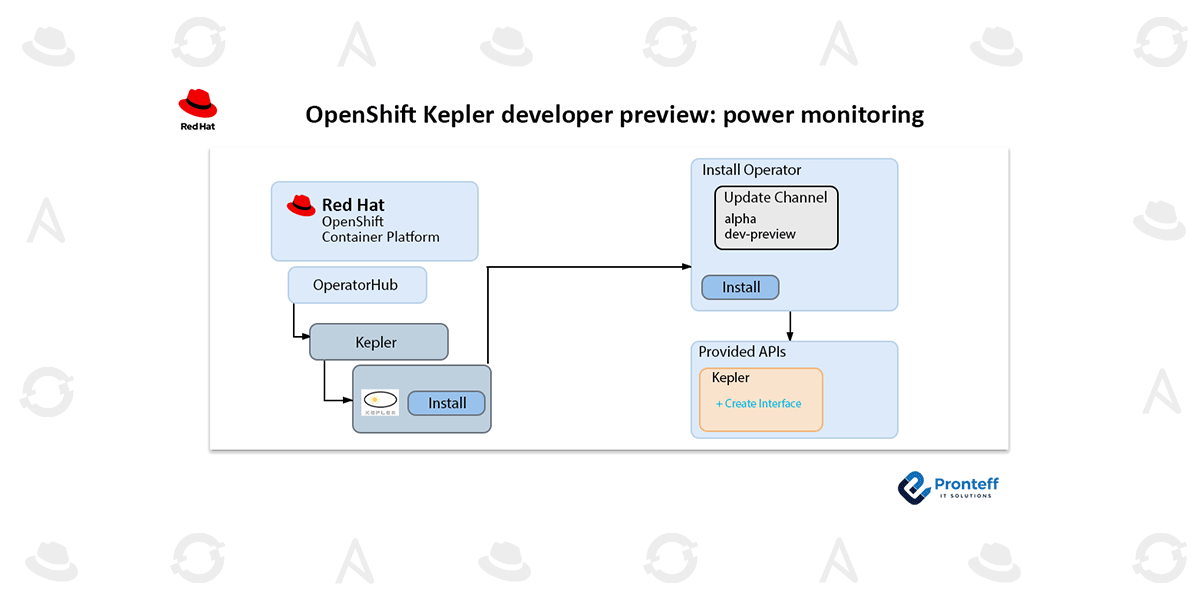
OpenShift Kepler developer preview: power monitoring
Kepler reached the CNCF Sandbox maturity level earlier this year, which is the entry point for early stage projects, as a result of all this community work. For more details, see the CNCF project metrics page.
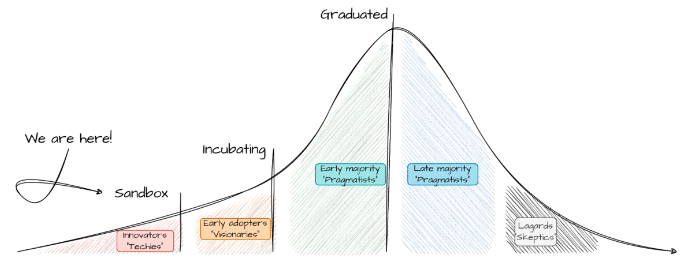
Given that the primary objective of this category is to promote public visibility, it appears that the time has come to enable all “innovators” and “techies” to use OpenShift by offering a developer preview of Kepler, which is OpenShift’s power monitoring solution for Red Hat OpenShift.
Even though all the information is already available upstream, let’s take a closer look at what has been occupying our time over the past few months in order to assist our users in experimenting with Kepler and envisioning how it can help them comprehend the distribution of power consumption throughout their cluster. We will demonstrate how to install Kepler and view power consumption metrics in the OpenShift console using the Kepler operator throughout this article. To make it easier to understand the contents and scope of this developer preview, as well as how to contribute to this exciting project for future advancements, we will first go over some of the magic that lies beneath the surface.
How does the power monitoring box work?
Kepler is a massive project that is supported by ongoing community contributions derived from state-of-the-art research. This indicates that Kepler offers a growing range of features with varying degrees of maturity every day. We shall proceed cautiously, as with any thrilling adventure.
As previously mentioned, Kepler produces practical, high-granularity metrics by combining measurements and estimates from machine learning (ML) models. As the community progresses with validating the models and fine-tuning them to various footprints and architectures, our initial focus will be on supporting the metrics exposure of direct measurements and ratios. You can explore the Kepler model server features in the kepler-model-server and kepler-model-db public repositories if you’re interested in this work and would like to contribute.
Let’s concentrate on the value this developer preview brings for the time being.
Operator Kepler
In order to help any OpenShift administrator interested in using Kepler, the Kepler operator wants to be their first point of contact. Its objective is to streamline Kepler’s deployment and management into an OpenShift cluster, thereby offering a streamlined solution for individuals who wish to keep an eye on the power consumption of their workloads. Custom Resource Definition (CRD) that is specifically tailored is added to simplify its setup and configuration. Additionally, this operator helps with day-to-day tasks like redeploying, uninstalling, and upgrading. All things considered, the Kepler operator aids in directing and guaranteeing proper platform usage patterns. You can find its source code in the kepler-operator repository.
The central component of power monitoring is the operator-managed Kepler exporter, which collects and exports metrics about power consumption using eBPF. Let’s take a closer look at the Kepler exporter’s workings as this might all seem a little overwhelming.
Kepler’s eBPF
These days, eBPF is receiving a lot of attention. That should come as no surprise given that it can be used to safely and effectively increase the Linux kernel’s capabilities without requiring it to load extra modules or alter its source code. To put it briefly, hooking a function to a specific event is one of the most helpful features offered by eBPF. An action specified in that function is carried out in the event that it happens.
Kepler does this by extracting utilization metrics from the node components using eBPF and combining them with real-time power consumption metrics. As previously mentioned, there are a number of APIs available for this, including NVML, ACPI, and RAPL.
Ultimately, the next step is to compute a ratio to extract a process’s contribution to the overall picture, given the real-time power consumption metrics obtained from the native APIs and the utilization performed by each process. Kepler turned the idealistic idea of tracking energy consumption at the container level into a reality in an instant. It’s rather handy that the end user can access all of this data as Prometheus metrics.
Measures that are available
You might be curious about the appearance of this data. Users can see where the power is coming from by utilizing Kepler’s wide range of metrics that show the energy utilization broken down by contributors. But where should one begin? Users can quickly identify the metrics that are pertinent to them by reading the linked documents, as all Kepler Prometheus metrics begin with the kepler_ prefix and are defined in accordance with the Prometheus metrics guide.
The best place to start when trying to extract the energy consumption within a container is by examining kepler_container_joules_total, a very helpful counter that gives you the total energy consumption. In fact, this is the most efficient method of data collection because it eliminates the difficulty of condensing intricate queries into a single metric. To obtain the power in watts, simply compute the rate() over time of those joules if you are more interested in power consumption than energy. The kepler_node_core_joules_total counter on the node provides access to the same data.
Now, Kepler offers a breakdown of the energy consumption if you’re interested in knowing how contributions from each of the listed APIs add up to those total joules. All metrics, including DRAM, RAPL, and NVIDIA GPU, are accessible through a query distance. Finally, but just as importantly, Kepler also offers hardware data, including CPU cycles and node metadata like the node CPU architecture.
Virtual machines versus bare metal
When the necessary permissions are granted, the mentioned data sources and APIs can be accessed on bare metal clusters; however, those system power metrics are typically not available in virtual machines. It is not possible to measure power consumption directly in these situations. In the future, it appears highly likely that the estimation modeling offered by the Kepler model server and Kepler DB will close the circle for all use cases.
Remember that Kepler currently uses an estimator that applies a basic pre-trained model tuned for a specific example setup, which may not match your specific VM/hardware, when the aforementioned APIs are unavailable. View the pre-trained models’ full details here.
Making use of the developer preview for power monitoring
Now let’s install the developer preview of power monitoring in an OpenShift cluster.
We have replicated these steps on OpenShift 4.13. Since power monitoring is still in developer preview, before general availability, users should anticipate significant changes.
Activating and setting up monitoring for projects that the user defines
Make sure that monitoring for user-defined projects is turned on before deploying Kepler by following the guidelines in the OpenShift Container Platform documentation. To sum up, all that needs to be done is include “enableUserWorkload: true” in a ConfigMap. The user-workload-monitoring pods should be prepared when you type the following to see if it is enabled:

In any event, it is advised that readers review the most recent documentation.
Setting up Kepler
The OpenShift Container Platform web console’s Operator Hub is used to install the Kepler operator.
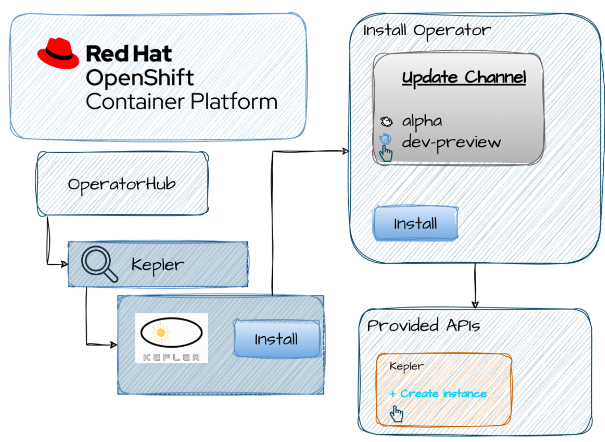
1. To access the OperatorHub, navigate to the “Operators” tab located in the left-hand sidebar of the OpenShift dashboard. You can locate the community version of the Kepler Operator by searching for it on the OperatorHub.
2. Install: To view information about the operator card, click on it. This will give you details about the operator, such as its maintainers, version, and description. Links to the FAQ and documentation are also included in this. Take your time and carefully peruse the available resources. Click Install to configure the operator after you’re finished.
3. When the “Install Operator” dialog appears, select “Update Channel” as dev-preview rather than “Alpha.” Click Install after leaving the remaining parameters as they are.
4. Hold off until the installation is finished. You should be able to view the Kepler Operator details by clicking on “View Operator” once the “Installing Operator” dialog has finished. Moreover, observe that the “Installed Operators” sub-menu ought to now have Kepler Operator listed.
5. We can now instruct the operator to launch Kepler by launching a Kepler Custom Resource Definition (CRD) instance. Click on Create Kepler after selecting the Kepler tab under the newly available Kepler operator. In the end, this will produce a Kepler exporter DaemonSet. At the bottom will be a message indicating when the DaemonSet is prepared.
In order to accomplish our ultimate goal of monitoring power in the Red Hat OpenShift console, this will also make a few dashboards available in the OpenShift Console!
Power monitoring visualization in the OCP console
Red Hat OpenShift users can now get a Dev Preview of power monitoring through the Web Console. Users can utilize two dashboards under the Observe>Dashboards UI—(1) Power Monitoring / Overview and (2) Power Monitoring / Namespace—which offer varying degrees of detail regarding power consumption metrics for a single cluster—by installing the recently released Kepler Operator, as outlined in the section above.
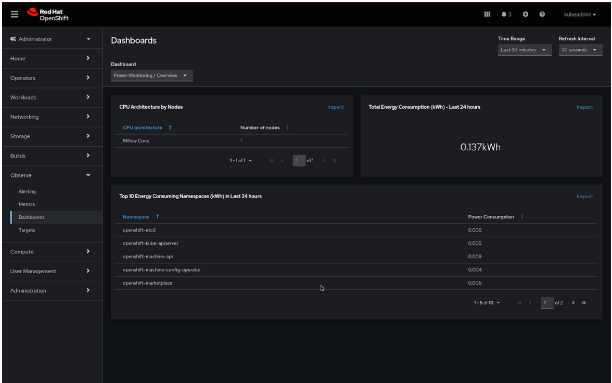
What data can you see? The (1) Power Monitoring / Overview dashboard shows you the total energy consumption (in kilowatt-hour) that your cluster has experienced over the last 24 hours, along with the CPU architecture that you have chosen and the total number of monitored nodes. You can also see a table that shows you how much power your cluster’s top 10 namespaces have used over the past 24 hours, which enables you to take appropriate action to reduce excessive consumption without having to look into each namespace individually.
Users can also utilize the (2) Power Monitoring / Namespace dashboard in addition to this first overview. You have the option to drill down by namespace and pod using this view. To be more precise, you will be able to see important power consumption metrics by namespace, such as consumption in DRAM, PKG, GPU, and other areas. This will make it easier for you to look into significant peaks and determine the main reasons behind excessive consumption.
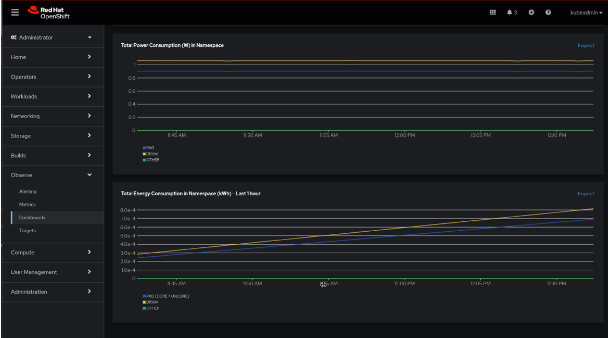
We are eager to hear your thoughts on the charts’ usefulness for your use case and how easy it is to navigate.
Take out the power monitoring
Once finished, delete the operator and the kepler instance as you would any other package to get rid of the kepler. Remember to adhere to the guidelines for turning off monitoring for user-defined projects when you’re done using it.
For knowledgeable users: Building custom dashboards
That’s not all, though. In order to experiment and build your own Grafana dashboards, the community also offers scripts and instructions for deploying a community dashboard. If you’re interested, check out the documentation for the community.
Giving Recommendations
We value and welcome any feedback regarding this new project, even though power monitoring for Red Hat OpenShift is still in the experimental stage and will likely undergo significant changes in the coming weeks and months. By starting issues in the kepler-operator or kepler and by joining the CNCF slack #kepler-project channel, community members can provide input. We welcome inquiries and comments from OpenShift users via their account teams, and we would be pleased to schedule meetings to go over power monitoring for Red Hat OpenShift and our upcoming plans.
Please be aware that we are not currently taking support cases for this feature as it is a developer preview.


