What’s new in V10.0.5.0 Analytics Dashboard in API Connect
Here in this blog, we will learn about what’s new in V10.0.5.0 analytics dashboard in API connect.
Kibana is no longer used and has been replaced with new analytics dashboards in the API Manager UI. Additionally, you can now access your analytics data using a new REST API. OpenSearch has replaced Elastic search in the Analytics subsystem, resulting in a distinct collection of micro services.
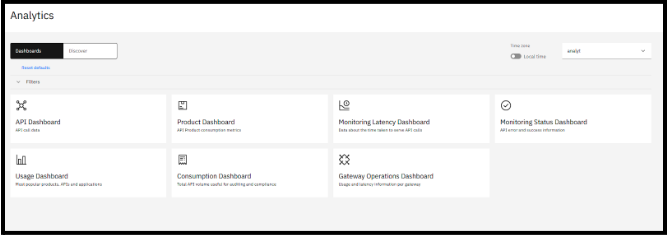
The new V10.0.5.0 analytics is also introduced in the cloud manager also with the all filters in it. The filters it contains are below:
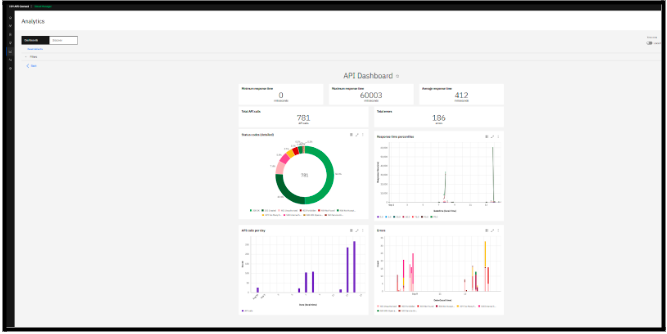
- API Dashboard- includes charts showing the total number of API calls, response codes, and response times.
- Product Dashboard – includes graphs displaying the total number of API calls and application subscriptions by plan.
- Monitoring Latency Dashboard – includes charts showing data use and response time statistics.
- Monitoring Status Dashboard – includes charts that display the success/failure rates of API calls and response codes.
- Usage Dashboard – includes charts displaying the top five products, apps, and APIs.
- Consumption Dashboard – includes charts displaying the entire API usage in your cloud.
- Gateway Operations Dashboard – includes charts displaying API usage and gateway latency.
What is OpenSearch?
OpenSearch is an open-source search and analytics engine. It is a community-driven project that originated as a fork of Elastic search, another popular search and analytics engine. OpenSearch is designed for various use cases, including full-text search, log and event data analysis, and other data exploration and analytics tasks.
Features of New Analytics: –
- The message queue feature has been replaced by log stash permanent queues.
- The backup and restore process has been modified, it is necessary to rebuilt S3 backup secret after the upgrade.
- The Cloud Manager UI now includes a new analytics dashboard that enables the administrator to examine analytics API events for each defined analytics service.
- The capability of saving analytics queries was introduced.
Advantages of New Analytics: –
- Queries are shared only with the specific scope they exist in; they do not cascade to lower scopes.
- Users can now share saved queries with other users and these queries are created at a specific scope (such as a specific catalog, space or provider organization).
- No customizable dashboard required. But it is easy to change and achieved by simply creating a query in the UI
Disadvantages: –
- The update to version 10.0.5.0 or later will result in the deletion of all existing analytics data. Before upgrading, you must export your analytics data if you wish to save it.
- All operation which is covered by Curl_es operations are no longer supported.
How V10.0.5.0 Analytics Dashboard looks like?
- Analytics is also added in Cloud Manager which shows overall API and other fields in the dashboard when your login to Cloud Manager as shown below.
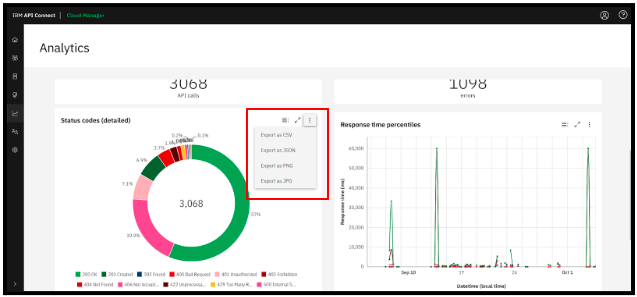
- A PNG or JPG image can be exported for each chart in the dashboards. All chart’s original data can be downloaded as a JSON or CSV file in both API Manager and Cloud Manager.

- The Dashboards tab is shown by default. Select Discover to examine your API event data in tabular format.

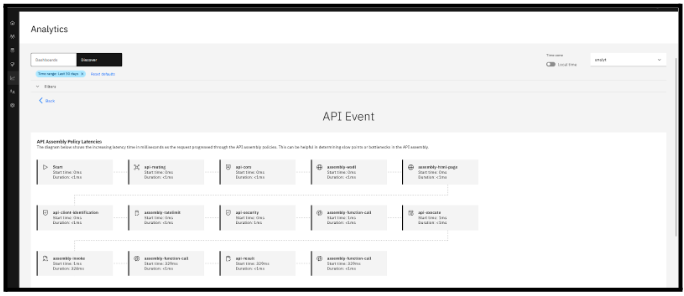
- We can see the latency and usage of the API Gateway (IBM Data power).
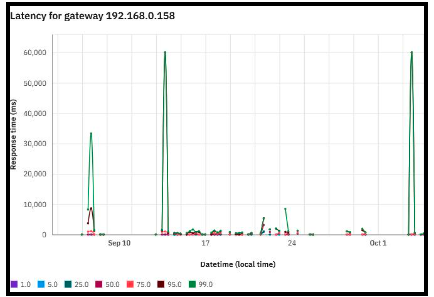
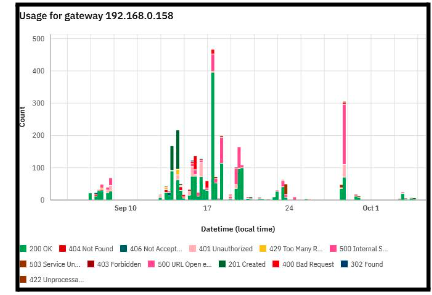
- By creating queries, you may filter the information seen in the Dashboards and Discover views. To examine, define, and apply analytics queries to your displayed data, expand the Filters section:
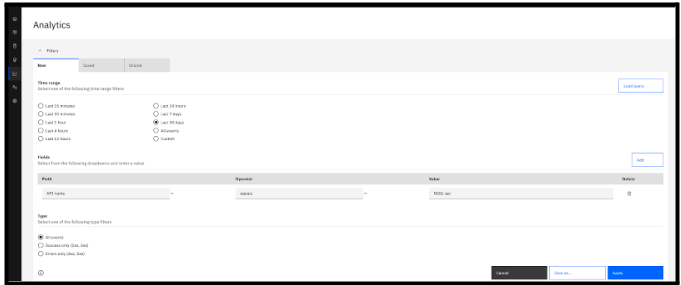
- We can save the queries and for usage in REST API and toolkit CLI, saved queries can be exported as strings. As shown below
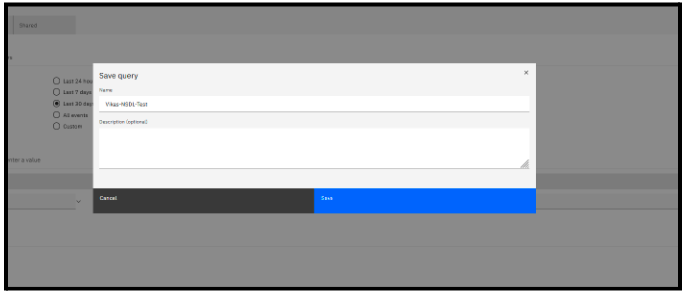
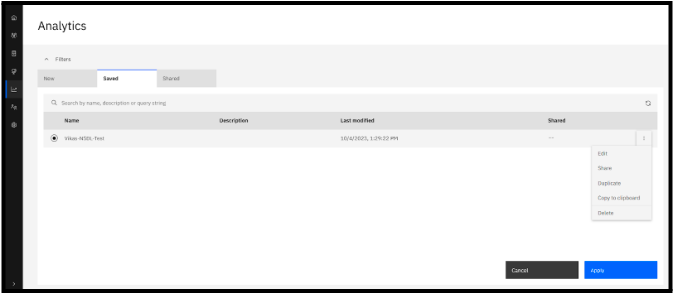
Here is the copied string: – api_name=equals:NSDL-api&timeframe=last30days.
- Here we can see the both Error and Success data that includes their status code and API Name.
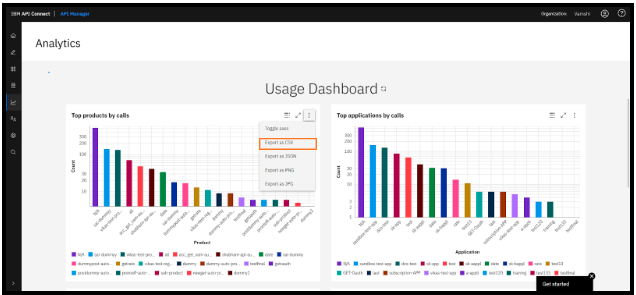
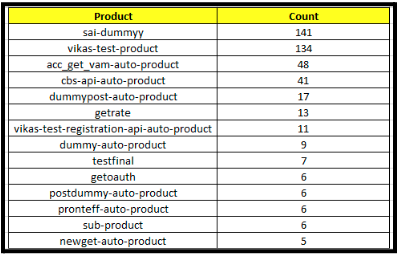
- Here we can download the Top Products by calls in CSV format which is an excel sheet and we can send to the client if required no work of entering it manually.
Here is the below CSV Sheet: –
