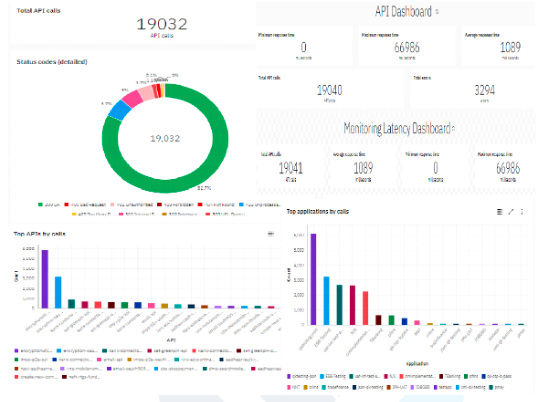
Analytics Dashboard in API Connect
Here in this blog, we will learn about Analytics Dashboard in API Connect.
For API Connect components, the Analytics subsystem plays a vital role as it stores the transaction logs for both success and failure scenarios.
We have a manager UI called API manager UI controlled by API manager administrators, where they could monitor API event data.
What are the most common features of Dashboard:
For API Connect, the vital features of making and understanding the API calls consumed by the customer are visible by a wide variety of graphs and pie charts where you can monitor the success response as well as error and failure response along with status codes using colors.
We have filters for a specific time, by the particular application that the API has consumed, and we are able to see with the particular product of that API.
We have 7 wide varieties of dashboards in Analytics
The following are options are listed below:
1. API Dashboard.
2. Product Dashboard.
3. Monitoring Latency dashboard.
4. Monitoring Status Dashboard.
5. Usage Dashboard.
6. Consumption Dashboard.
7. Gateway Operations Dashboard.

API Dashboard:
In this Option, we would able to see the Pie charts of the APIs with respect to success and failure status along with the reason codes and response time.
Product Dashboard:
In this option, we could see the pie and graphs of total API calls, with respect to application and subscriptions for individual plans.
Monitoring Latency Dashboard:
In this option, we would be able to see graphs with response time stats and data usage.
Monitoring Status Dashboard:
In this option, we would able to see pie charts of success/failure calls of APIs along with the response codes.
Usage Dashboard:
This option would show the top 5 API products and applications.
Consumption Dashboard:
In this option, we would see the overall API consumption in the Cloud Environment.
Gateway Operations Dashboard:
In this option, we would able to see the API usage and latency from Gateway.
Another option is embedded within the dashboard which is called Discover. We could see the API call data in detail with different formats such as JSON & table format. We also have the option to export the data


