Zabbix and Prometheus API monitoring for OpenShift
Here in this blog, we will learn about how to monitor Zabbix and Prometheus API for OpenShift.
I’ll connect to the Prometheus/Thanos API using Zabbix, giving me access to all environment metrics, including those for etc, pods, containers, infrastructure, and custom apps.
Using the LLD (Low Level Discovery) resource, I will create a template that will process the metrics I define for collection and produce the items and triggers.
Required conditions:
- The cluster-admin cluster role holder
- Zabbix Server or OpenShift 4.12 or higher
- Opening an OpenShift Service Account
Make a Service Account in OpenShift to be used with the Zabbix connection to Prometheus/Thanos.
Connect to OpenShift using the oc CLI, then take the actions listed below:

Retrieve the service account token for Zabbix-SA:

Gather the endpoint of Thanos:

Form a host group.
To organize OpenShift hosts for monitoring, create a host group.
To accomplish this, select Data collection > Host groups > Create host group > Define the Group name, then click Add from the menu on the left.
Make a template.
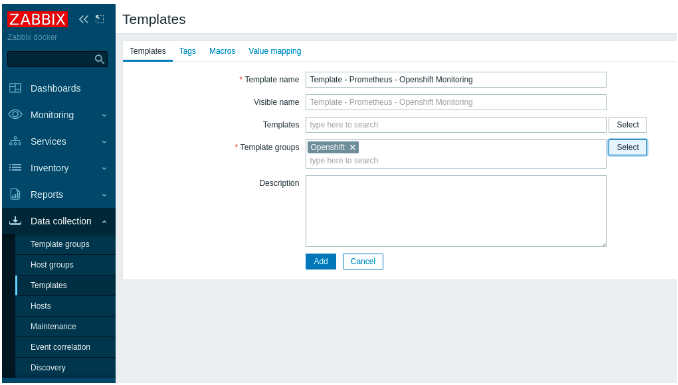
Next, make a template so that other hosts can utilize the monitoring again.
Click Data collection > Templates > Create template > from the menu on the left. Establish the Template name. Enter the desired name in Template groups, then select the newly available option. Press the Add button.
Make a thing
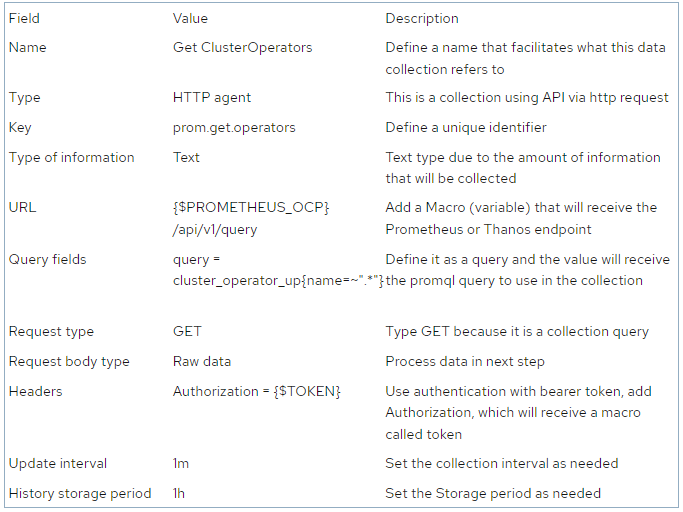
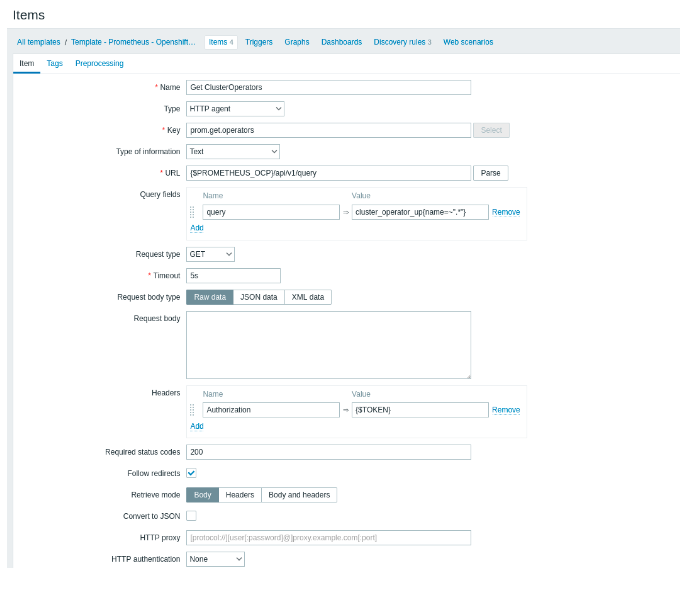
Make the initial item. Define the first LLD’s metrics, authentication token, and Prometheus/Thanos endpoint in it.
To access the Templates menu on the left side, select Data collection. Choose the previously created template > After selecting Items at the top, select Create item.
Make a piece of code that queries the status of every Cluster Operator.
Once the recommended fields have been completed, select the Preprocessing tab and click Add.
JSON Path:
- Assign JSON Path to Name
- Include the following in Parameter: $.data.result[*]
JavaScript:
- Put JavaScript in the Name
- Add this block to Parameter:
This script shows only the operator name and state after filtering the entire collection’s output.
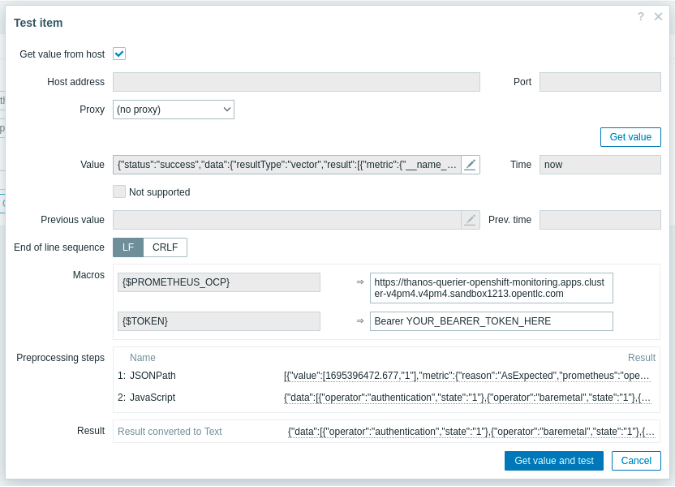
Click Test all steps to confirm that the preprocessing is operating as intended.
After checking the box labeled “Get value from the host,” adding the Macros values, the bearer token, the Thanos or Prometheus endpoint, and clicking “Get value and test,”
Validate the processed output in Result by using the JavaScript data that you selected.
Once all required tests have been completed, click Update to save the item and close the test window.
Establish rules for discovery.
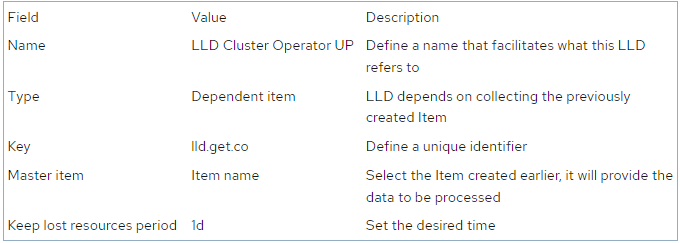
Create a Discovery after that. It will process the information gathered by the item you created in the previous step and generate the triggers and items on the fly.
Click Discovery rules > Create discovery rule while you’re still in the Template.
Click LLD macros now. To obtain the operator and state data defined in the JavaScript, add two macros.
After selecting Update, click Add, then make the two macros indicated below:
$.operator {#OPERATOR}
{#STATE} => $.state
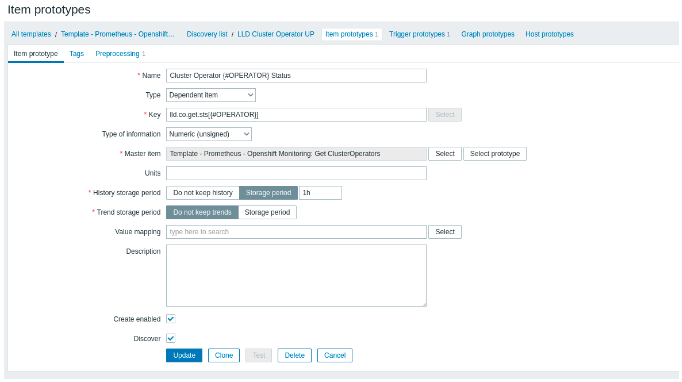
Click Item prototypes and then Create item prototype after selecting Update.
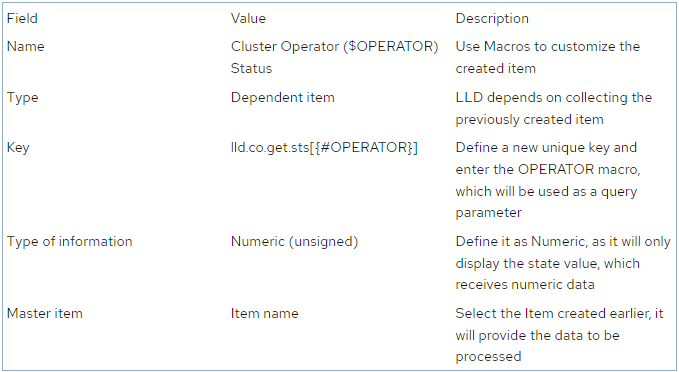
Make the Item Prototype now. It is a template for creating dynamic items. Complete the following fields:
After selecting Preprocessing, select Add. After adding the subsequent preprocessing step, select Update.
$.data[?(@.operator=='{#OPERATOR}’)] is the JSONPath…state.first()
This parameter filters the output by telling it that the operator will only display the state value for this operator and that it will equal the value of the OPERATOR macro.
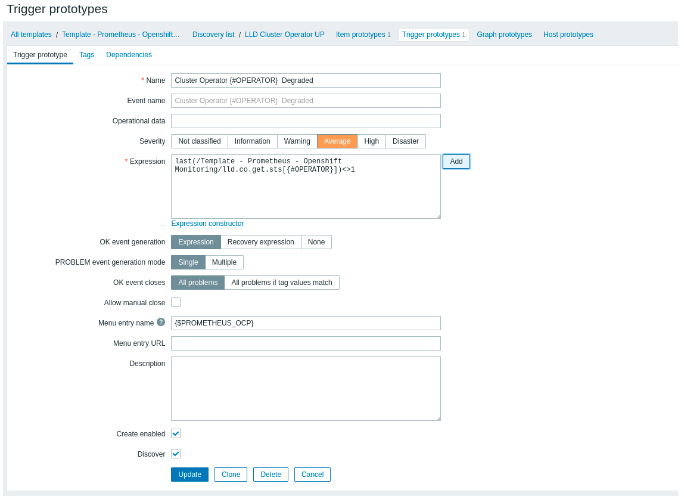
Click on the prototype of Trigger now. Set up a notification for when an operator is degraded.
After selecting “Create trigger prototype,” enter the information below:
After choosing “Create trigger prototype,” fill in the following fields:
- Object => To choose the previously created prototype item, click on Select prototype.
- Function => To utilize the most current value in the expression, use last().
- Outcome => Make an expression that notifies you when last()’s value deviates (<>) from 1.
This is how the Trigger Prototype will appear once it is completed. Press Update.
Establish Host
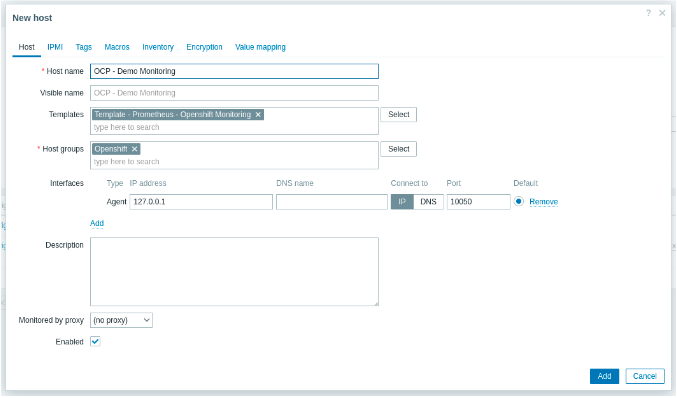
Create the Host next, as it will be in charge of supplying the Zabbix token and the Thanos endpoint. That template will be given to it.
To accomplish this, choose Data collection > Hosts > from the menu on the left. Make a host and enter the information below:
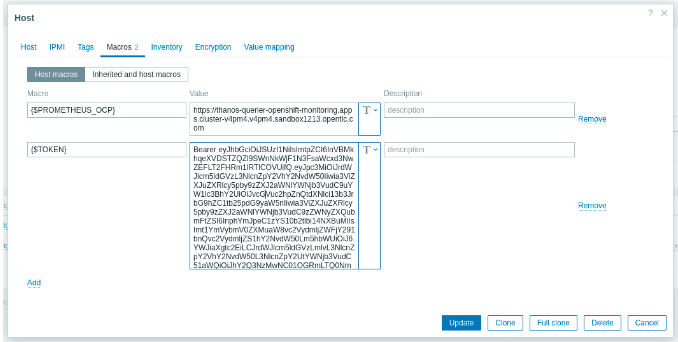
On Macros at the top, click. Include two macros. The zabbix-sa service account token will be sent to the second, and the thanos-querier endpoint to the first. Both were gathered in this article’s first step.
After selecting Add, add the ensuing macros:
To complete the host’s creation, click Update. Hold off until the LLD is carried out.
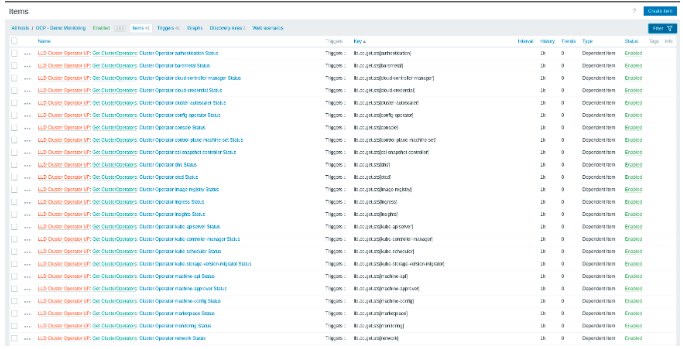
Items and Triggers will be created on the host after the LLD executes. Click Item to confirm these.
All of the created items are viewable. Through LLD, a corresponding trigger has been created for each Cluster Operator.
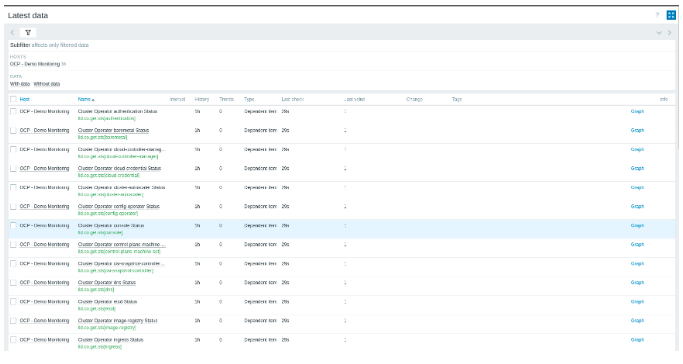
Click Monitoring > Latest data from the left side menu to confirm the data that is being gathered.
Information like the item, the last check, and the last value collected are all visible.


